Hi everyone, first let me say you are doing an amazing work and this is a very helpfull tool for data visualization.
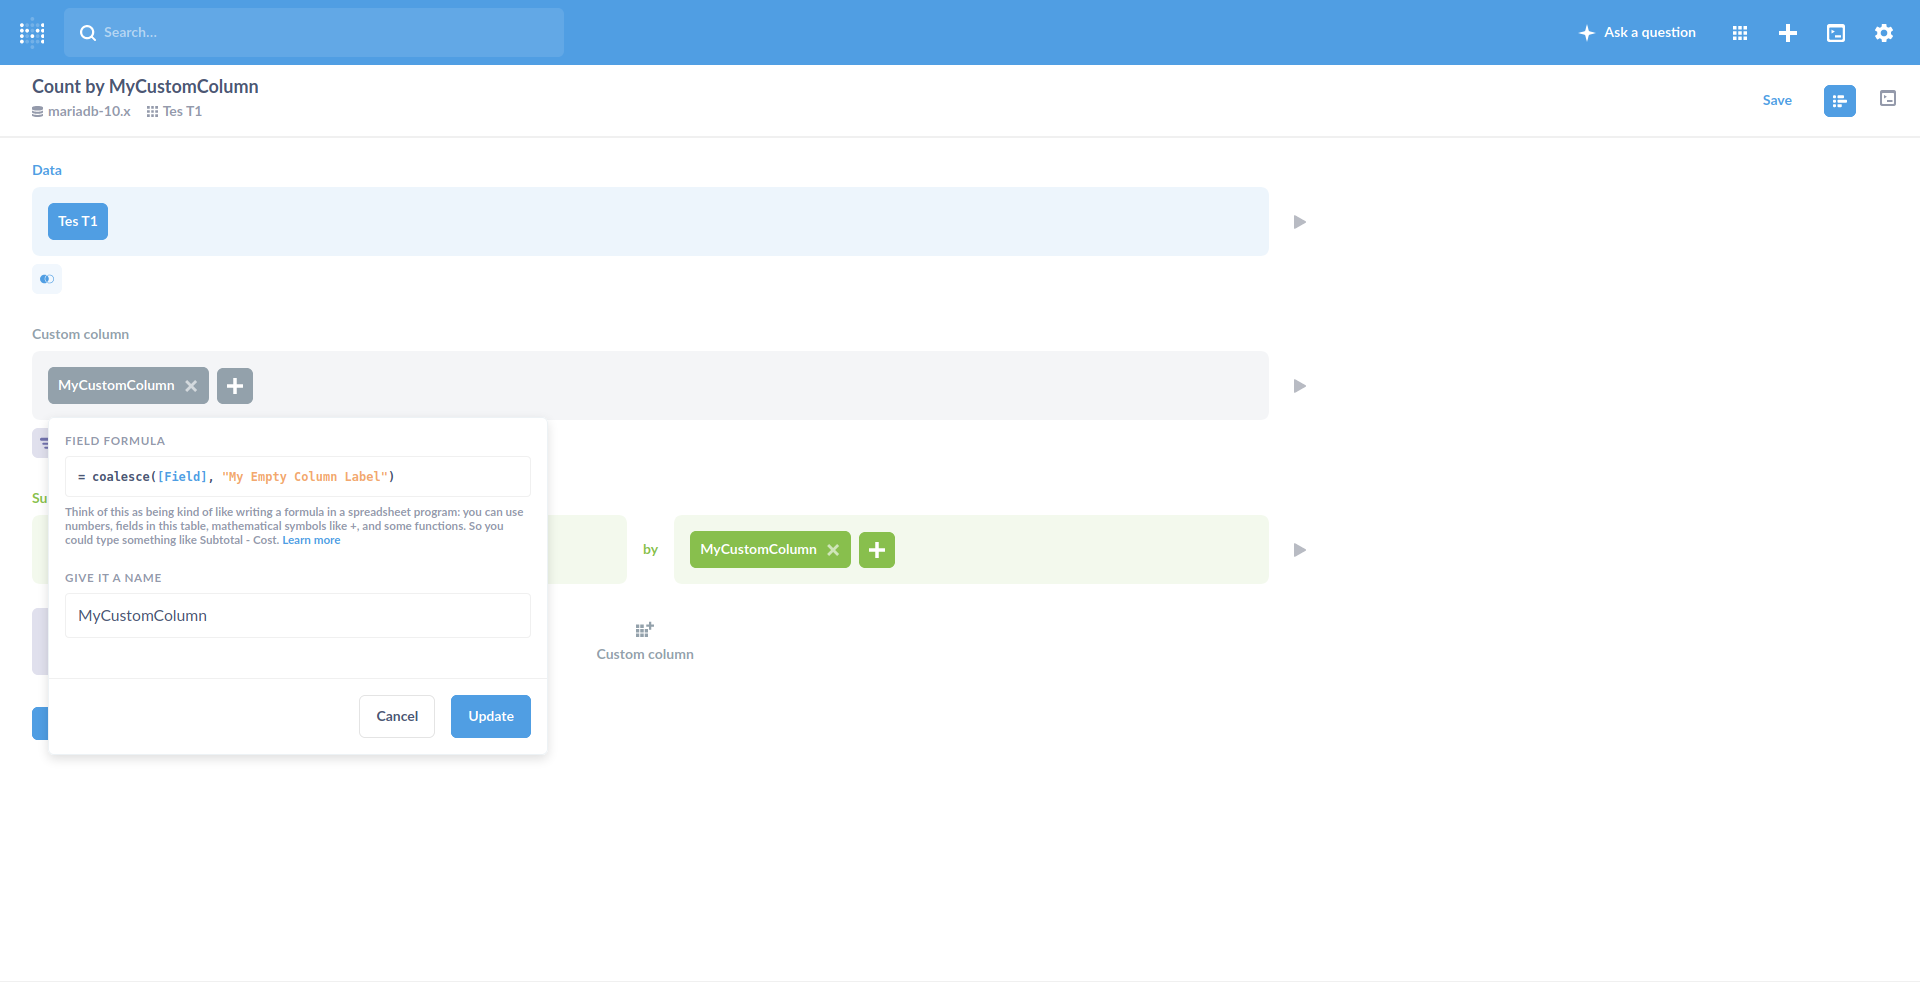
I have a simple question "how can I add labels in reference list?"
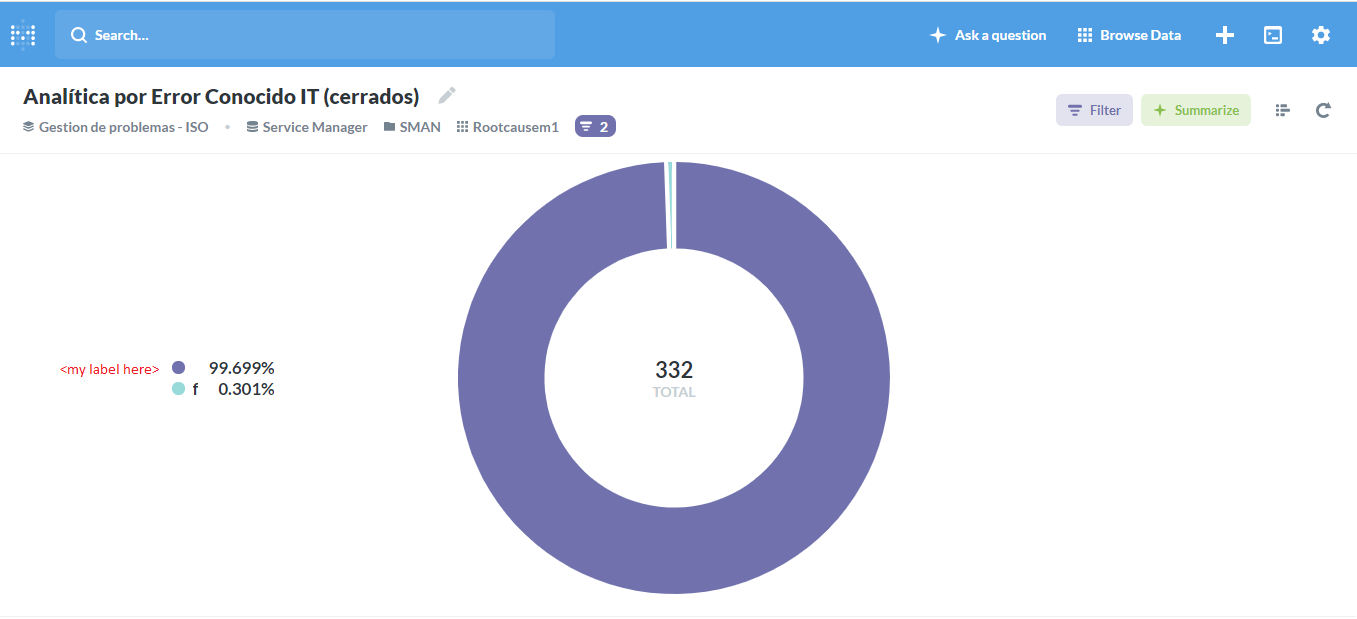
Let me explain the escenario: Having a row with empty values, the reference list only shows the percent of this value ocurrences. Of course it's OK, cause the referenced value is empty. The problem is that I can't see it..! In this case, a label added is the simplest solution but I can't figure it out how to do this. Please see picture below. Thanks in advance and kind regards.