We don’t currently support spacialdimensions.
Regarding country maps, you can select which column to use for the map, but clicking on the gear icon for chart settings and picking the column with the key and the column with the metric.
We don’t currently support spacialdimensions.
Regarding country maps, you can select which column to use for the map, but clicking on the gear icon for chart settings and picking the column with the key and the column with the metric.
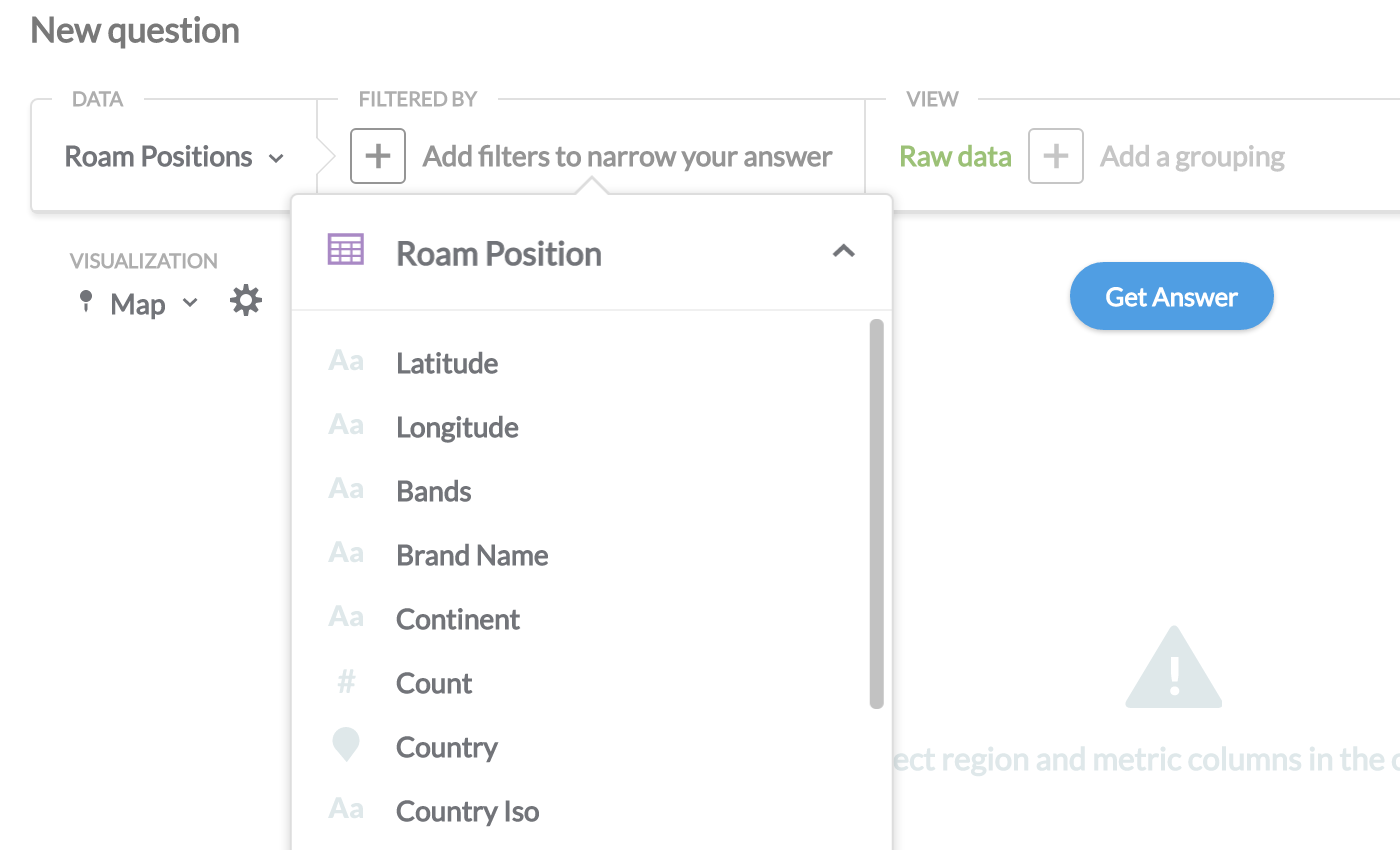
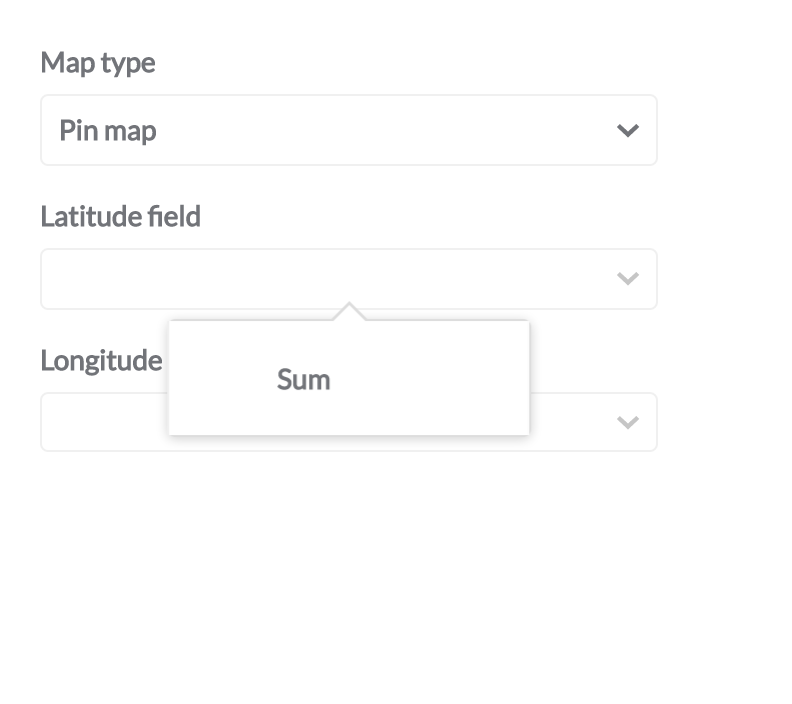
I've tried with the master branch and can't seem to select the right columns for lat/lon or region. Only one options appears called "sum".
List of columns:
Hmm… in the data model/schema what is the type of “latitude” + “longitude”?
Also for the US region map, all the keys are states and we’re looking for a field with type “states”.
I'm using Druid. AFAIK all dimensions have the type "string", right? Can I tell metabase that they are of a different type?
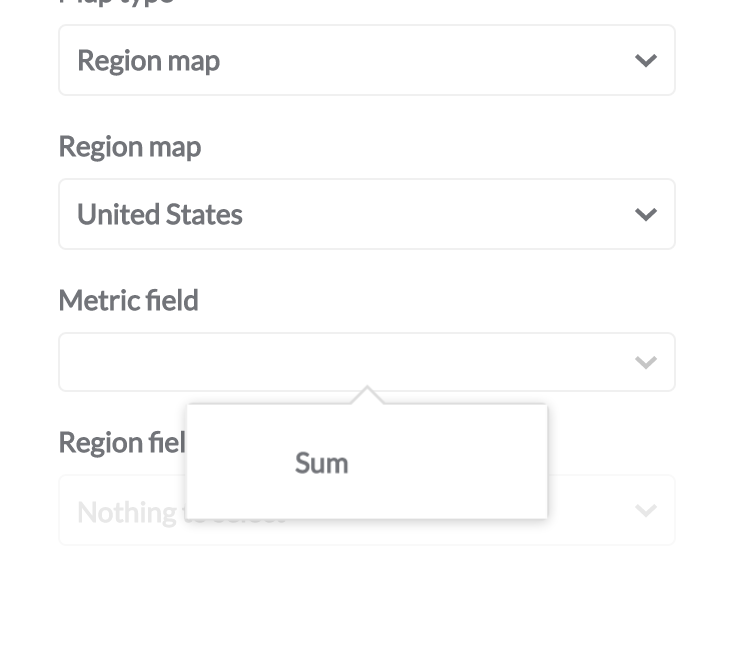
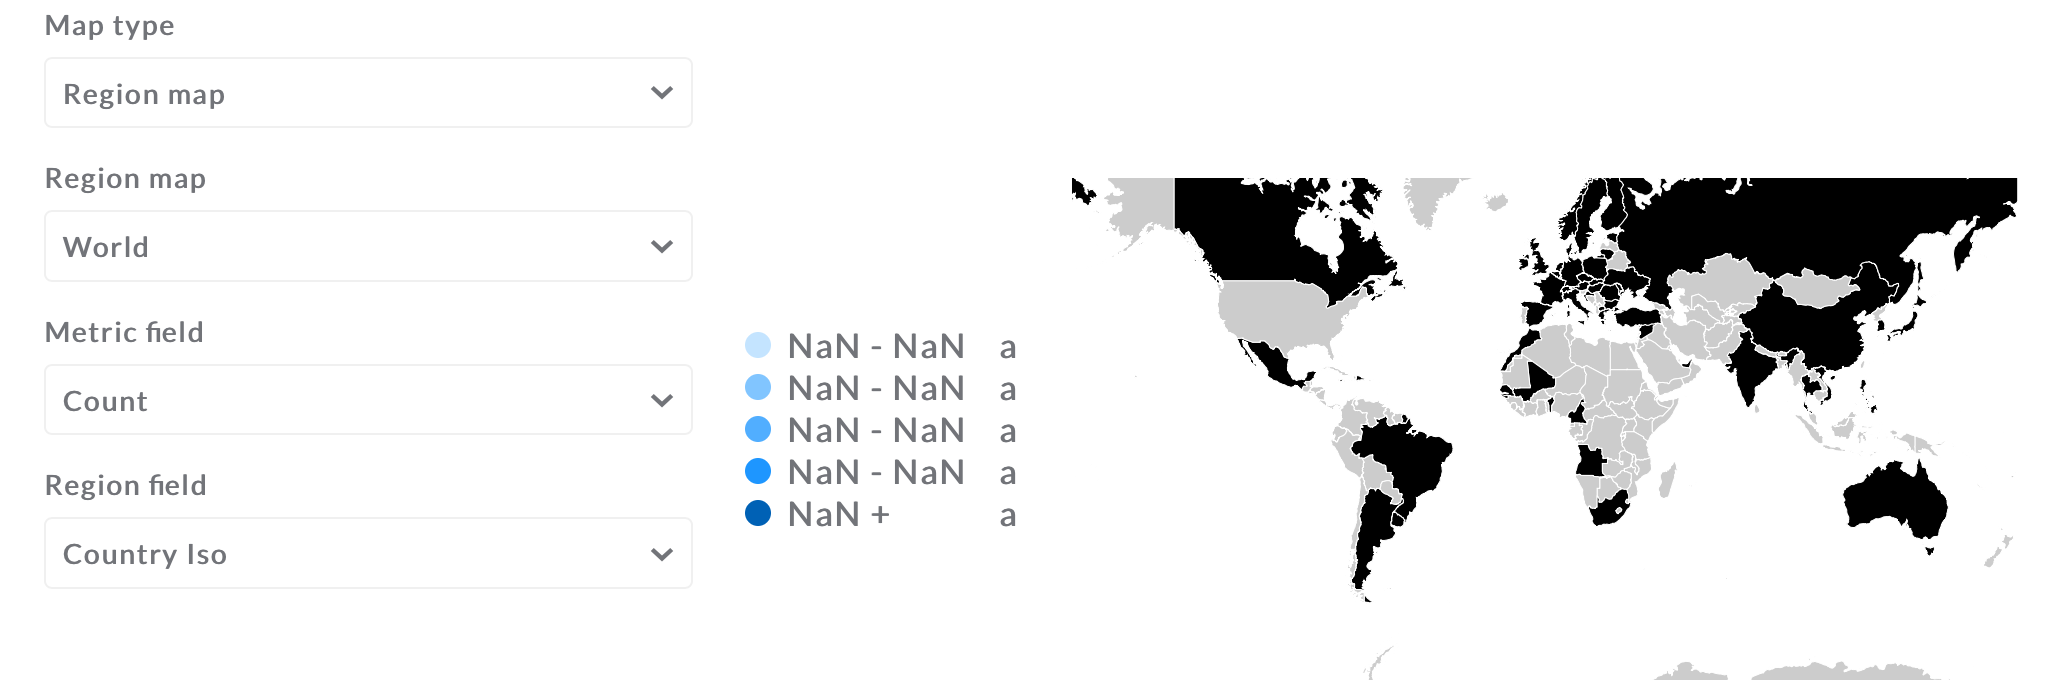
I've managed to progress a bit, it seems that the view you choose in the outer menu influences the fields you can pick in the Map menu:
You can go to the “Data model” page in the admin to set types if we haven’t auto-discovered them.
Can you share the query results + the underlying data schema definitions? It’s very difficult to try to unpack what’s going on based purely on the settings dialog information.
I’ve since been able to correctly define the types and I can obtain a map visualization. One of the problems I was having was that there were too many points, and the jvm was throwing OOM exceptions and no point was displayed.
I guess I need some kind of heatmap visualization for so many points.
Thanks!
Huh. how big a result set was this? We should at least a clear error message in this case.
About 20k data points. How much memory would metabase need to plot 20k points in a map?
That’s really strange. How big were the rows you’re returning? 20k rows should be pretty non-dramatic.
@edevil Im planning to give this a try as well. Could you share what you needed to do to get this working ?
Hi,
We are trying to do the same with Druid where metabase does identify a column as Country but in Map visualisation not showing the distinction. It has generated 5data points (which cannot be configured in metabase)
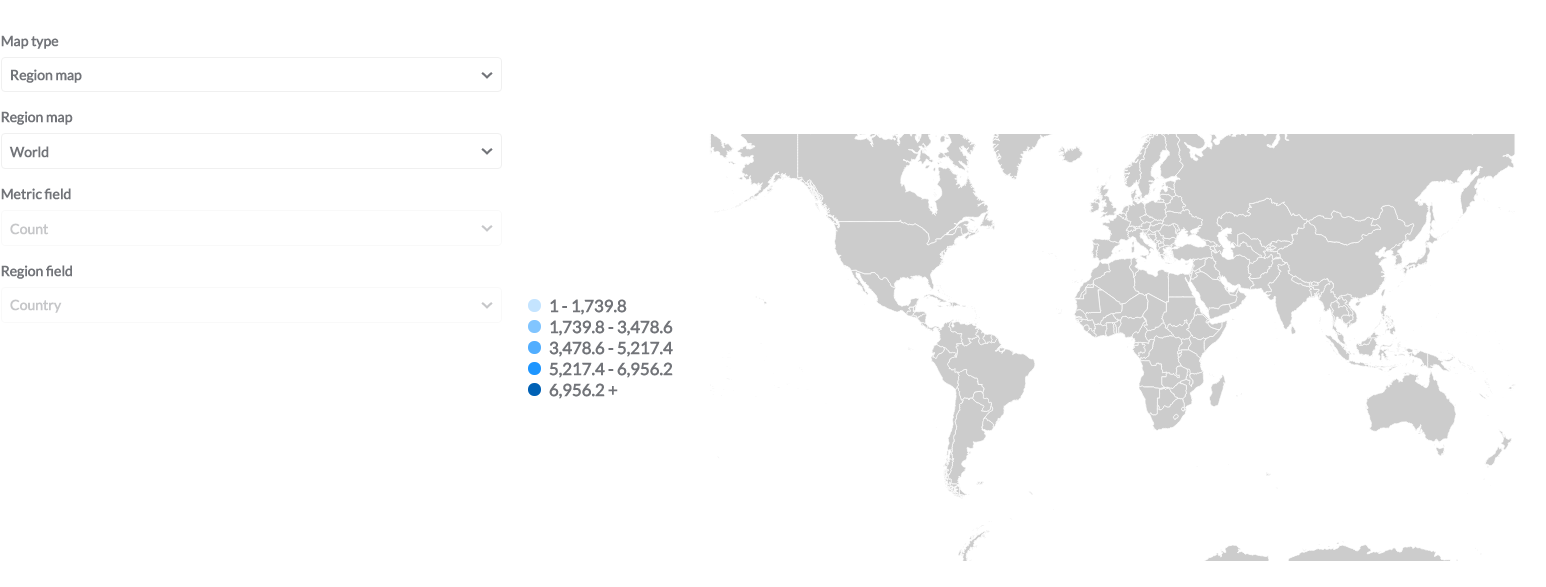
Map Visualisation
Can you please help to check what can be wrong here? How does it map underlying country value to the map's country?Please note that Druid does not allow to store column values as geojson.
what’s the table of result values look like?
and what country codes are you using in that column? while we’ll often mark a column as “country” we don’t always know how to transform the contents of the column to the keys in the geojson file.
Thanks for the quick reply Sameer...
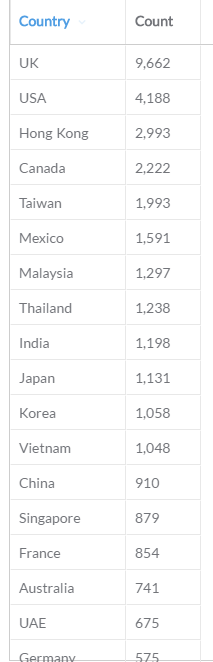
Currently countries are stored as simple string values...here is how the table view looks like..
What needs to be done for it to be properly mapped in metabase as country? If we provide the ISO code for a country will it work then?
Yes, ISO country codes are what we use
Hi Sameer,
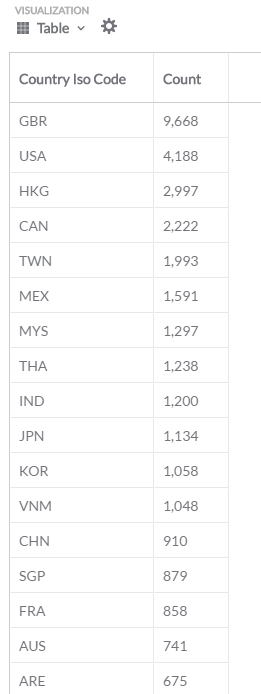
I did map the value to country ISO Code but it still doesn't show it in map.
Below is the table view:
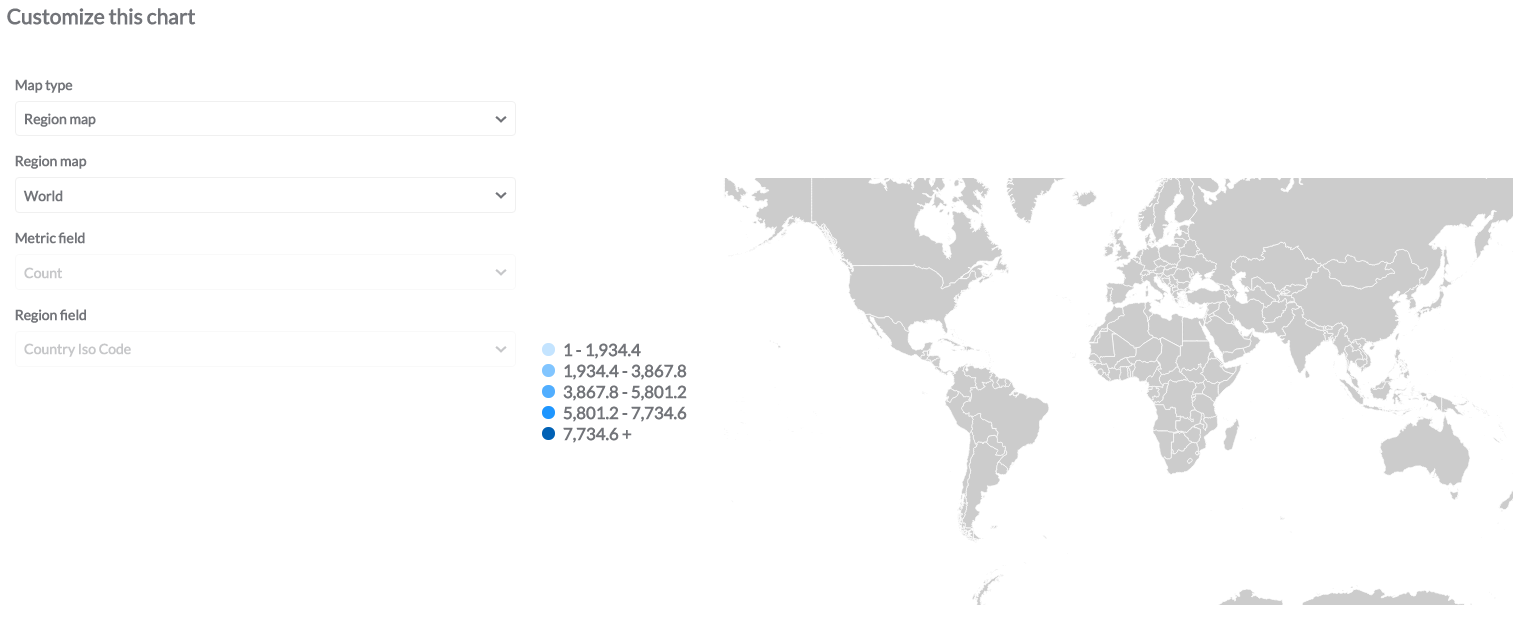
and here is how Map looks like
If you can refer me to the code, that would be useful as well.
Hi
Use 2 chars codes instead of 3 chars codes.
For instance FRA => FR; HKG =>HK…
cheers
https://github.com/metabase/metabase/blob/master/resources/frontend_client/app/charts/world.json is the actual geojson file we use to display this.
@vectalis is correct that we’re using 2 char codes.
Thanks both....Alpha2 Char codes worked. Will be good to document it somewhere,if not done already