I have caching enabled and set to:
MINIMUM QUERY DURATION: 10
CACHE TIME-TO-LIVE (TTL) MULTIPLIER: 60
And running a query that averages 20-25 seconds. Running it multiple times takes the same amount of time each time. I would expect the first query to be slow(ish), then it cache the result.
Is there a flag or way to see if a result is cached in the web interface?
The query I am running should be static, i.e. a date range
Hi @justink101
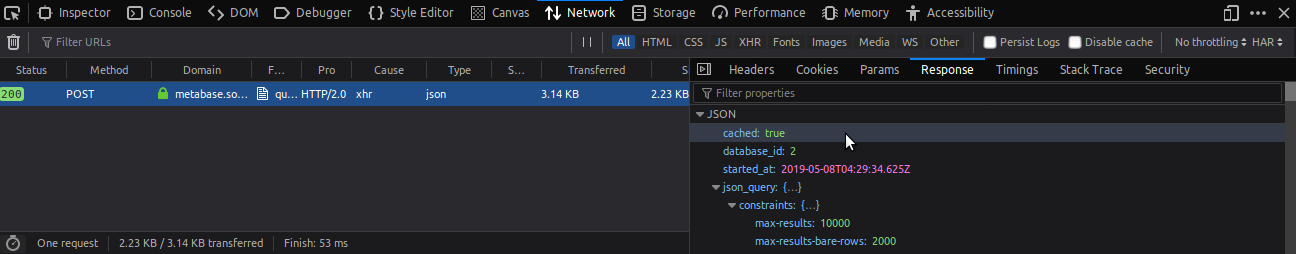
When you run the query, then check your browser console’s Network-tab, click the POST-request and check the Response-tab in the details panel.
It should tell you if the query is cached by having a cached: true
Which version of Metabase? And which database are you querying?
Metabase version: 0.32.5 (latest)
Database: MongoDB
Don’t see a cached response header. I am using Caddy web server to proxy requests to Java (.jar) directly. Not running in a docker container if that matters.
cache-control: max-age=0, no-cache, must-revalidate, proxy-revalidate
content-encoding: gzip
content-security-policy: default-src 'none'; script-src 'unsafe-inline' 'unsafe-eval' 'self' https://maps.google.com https://apis.google.com https://www.google-analytics.com https://*.googleapis.com *.gstatic.com ; child-src 'self' https://accounts.google.com; style-src 'unsafe-inline' 'self' fonts.googleapis.com; font-src 'self' fonts.gstatic.com themes.googleusercontent.com ; img-src * 'self' data:; connect-src 'self' metabase.us10.list-manage.com ;
content-type: application/json;charset=utf-8
date: Wed, 08 May 2019 03:14:10 GMT
expires: Tue, 03 Jul 2001 06:00:00 GMT
last-modified: Wed, 08 May 2019 03:14:10 +0000
server: Caddy
server: Jetty(9.4.z-SNAPSHOT)
status: 200
strict-transport-security: max-age=31536000
vary: Accept-Encoding
x-accel-buffering: no
x-content-type-options: nosniff
x-frame-options: DENY
x-permitted-cross-domain-policies: none
x-xss-protection: 1; mode=block
It's not about reverse proxy (sometimes used as web cache), it's only a cache for the query between Metabase and the database.
You need to check the Response-tab - in Firefox it looks like this:
Yes, that is what I am saying, from the browser don't see cached: true in the response. Using Firefox as well.
I’m not sure if it’s an issue specifically with MongoDB or not.
Does it make any difference if you change the duration to 1 second?
I set MINIMUM QUERY DURATION: 1 but still don’t see a cached property in the response body and query takes 20-30 seconds each time.
average_execution_time: null
context: "ad-hoc"
data: {,…}
database_id: 2
json_query: {database: 2, type: "query",…}
row_count: 424
running_time: 24800
started_at: "2019-05-09T02:30:35.139Z"
status: "completed"
How big is the actual result in kilobytes? And what have you set the cache limit to?
Do you see anything in the Metabase log that would hint on it skipping the cache?
Otherwise I don’t know and I would recommend that you create an issue:
https://github.com/metabase/metabase/issues/new
And what have you set the cache limit to?
MAX CACHE ENTRY SIZE: 2048
How big is the actual result in kilobytes?
Not sure, how can i see it?
The logs gives the impression it is working:
May 10 01:54:55 INFO metabase.api.card :: Question's average execution duration is 21693 ms; using 'magic' TTL of 1302 seconds 
May 10 01:54:56 INFO metabase.query-processor.middleware.cache :: Using query processor cache backend: :db
May 10 01:55:27 INFO metabase.query-processor.middleware.cache :: Query took 31447 ms to run; miminum for cache eligibility is 10000 ms
May 10 01:55:27 INFO metabase.query-processor.middleware.cache :: Caching results for next time for query
Where can I view to see if indeed the cache is creating files or inserting into?
I’m not sure if MongoDB adds something to the query (like timestamp in a comment), which then invalidates the cache. I recall something like that is an issue for BigQuery.
Download the result and check the size of the file.
You can check the table query_cache in your metadata (the Metabase backend database).
You can see the logs claim it is using the cache, but you see the requests take 27s, 26s, 25s each time run in a row. I bet you are right that MongoDB is adding something unique to the query. That’s sort of a problem as it means nothing can be cached using MongoDB.
May 10 02:03:15 INFO metabase.api.card :: Question's average execution duration is 22679 ms; using 'magic' TTL of 1361 seconds 💾
May 10 02:03:15 INFO metabase.query-processor.middleware.cache :: Returning cached results for query 💾
May 10 02:03:15 DEBUG metabase.middleware.log :: POST /api/card/1/query 200 [ASYNC: completed] 48 ms (6 DB calls) Jetty threads: 5/50 (3 idle, 0 queued) (49 total active threads) Queries in flight: 0
May 10 02:04:02 DEBUG metabase.middleware.log :: POST /api/dataset 200 [ASYNC: completed] 27 s (13 DB calls) Jetty threads: 4/50 (3 idle, 0 queued) (50 total active threads) Queries in flight: 0
May 10 02:04:35 DEBUG metabase.middleware.log :: POST /api/dataset 200 [ASYNC: completed] 27 s (13 DB calls) Jetty threads: 4/50 (4 idle, 0 queued) (48 total active threads) Queries in flight: 0
May 10 02:05:50 DEBUG metabase.middleware.log :: POST /api/dataset 200 [ASYNC: completed] 26 s (13 DB calls) Jetty threads: 4/50 (3 idle, 0 queued) (48 total active threads) Queries in flight: 0
May 10 02:09:55 DEBUG metabase.middleware.log :: POST /api/dataset 200 [ASYNC: completed] 25 s (13 DB calls) Jetty threads: 4/50 (2 idle, 0 queued) (49 total active threads) Queries in flight: 0
May 10 02:10:25 DEBUG metabase.middleware.log :: POST /api/dataset 200 [ASYNC: completed] 25 s (13 DB calls) Jetty threads: 4/50 (2 idle, 0 queued) (50 total active threads) Queries in flight: 0