Hi everybody,
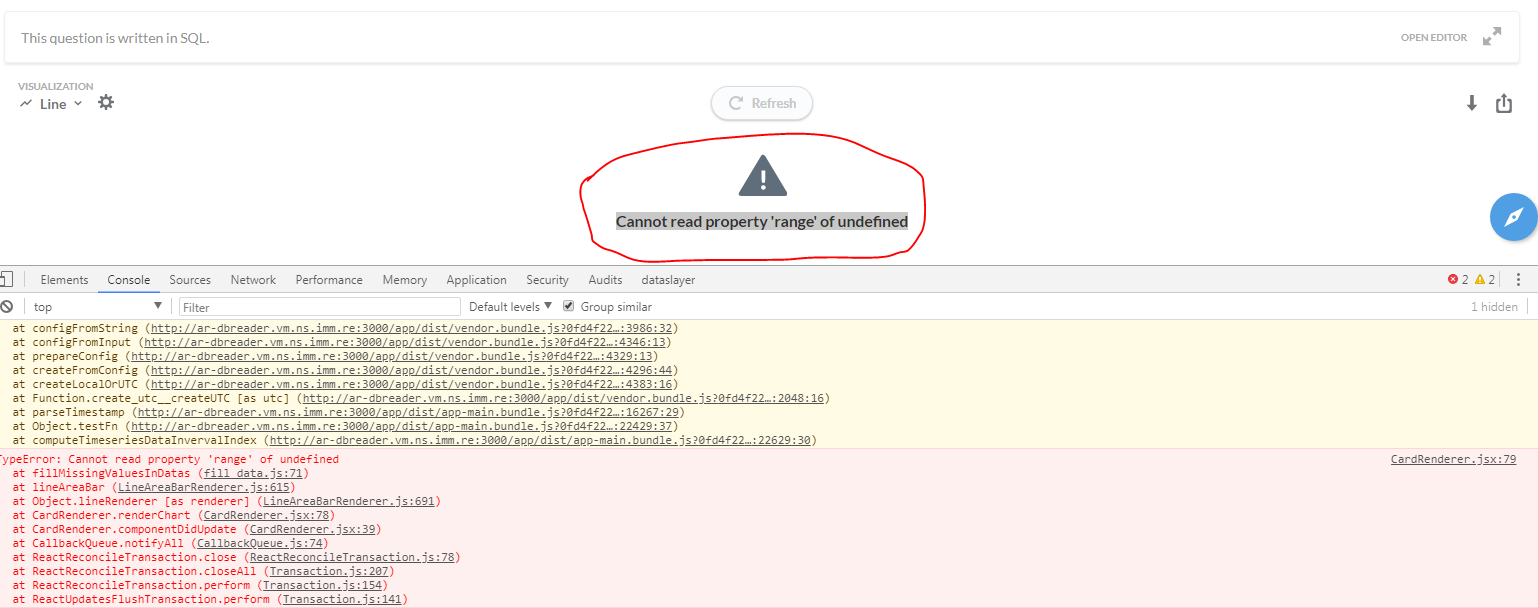
I'll post a screenshot that will be more explanatory than 1000 words.
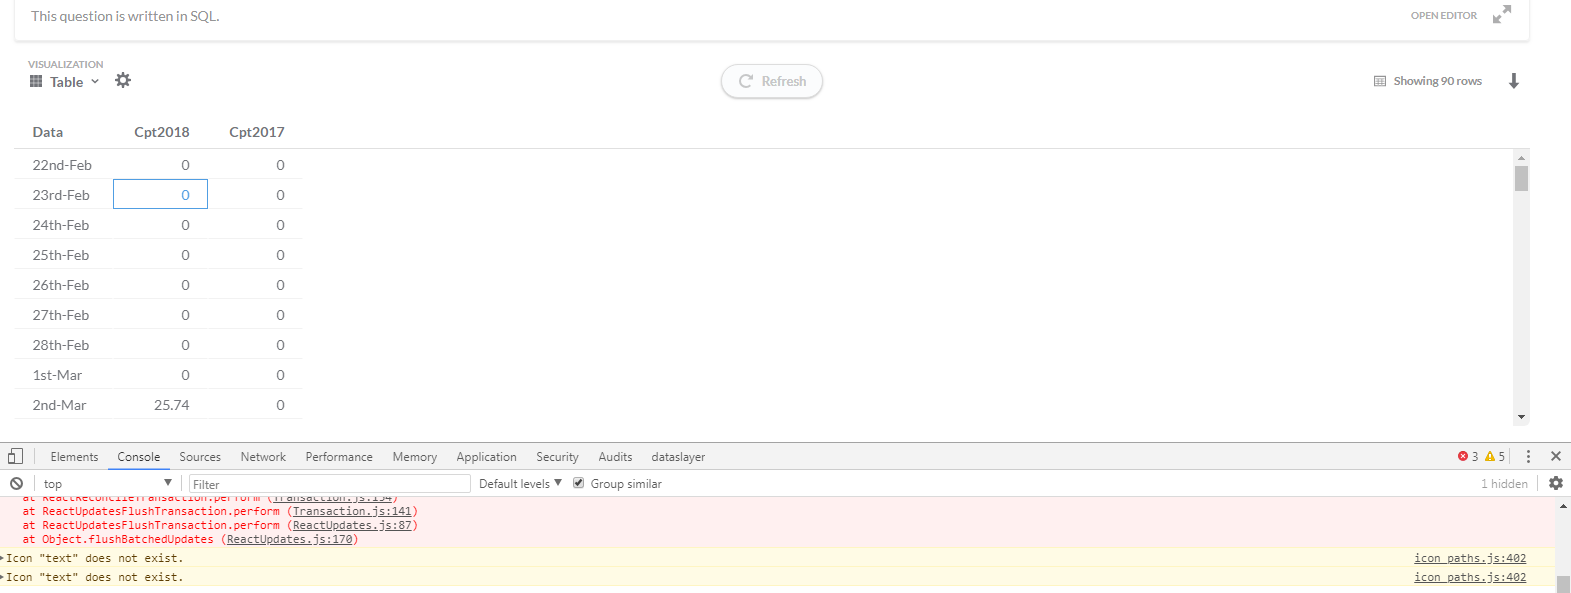
Only the graph isn't showed. In table format I've the result:
Anyone can help, please? Thanks in advance