I need to have the aggregation done at the dashboard level rather than at the question level. Aggregation should be alongwith filters so that I need not create different graphs for daily, weekly, monthly, quaterly aggregated data.
Yes I have, it doesn’t serve the purpose.
The use case here, as I mentioned, is suppose I have a graph plot for transactions trend. I need to see the trend daily, weekly and monthly for the last 3 months. In the current scenario, we can set up filter for ‘last three months’ but we don’t have a dashboard level aggregation from where I can change the aggregation between - daily, weekly and monthly - there by having just one graph.
Periscope has built this functionality exceptionally well.
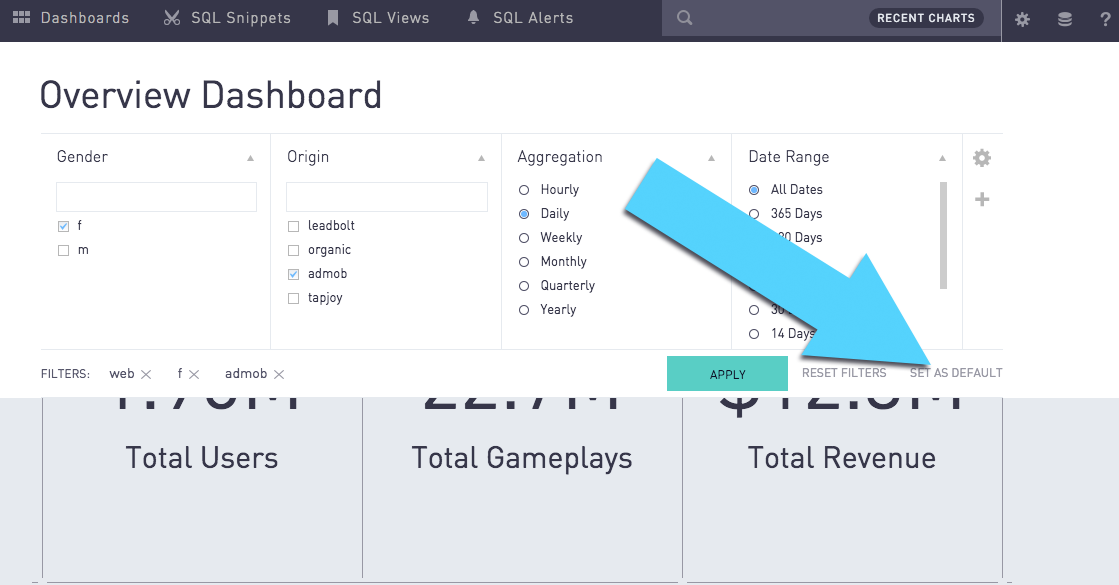
Ah, I follow you now — you'd like to be able to change the time granularity of the aggregations on the dashboard, like in this Periscope Data screenshot (ignoring the huge blue arrow):
I created a github issue here to track this suggestion: https://github.com/metabase/metabase/issues/3974
Thanks for the feedback.
Yes, you got that 
Hope to see it soon.!