Hi all, I’m creating a scatter plot based on 3 key variables for a bunch of companies (stock symbols).
So currently I have:
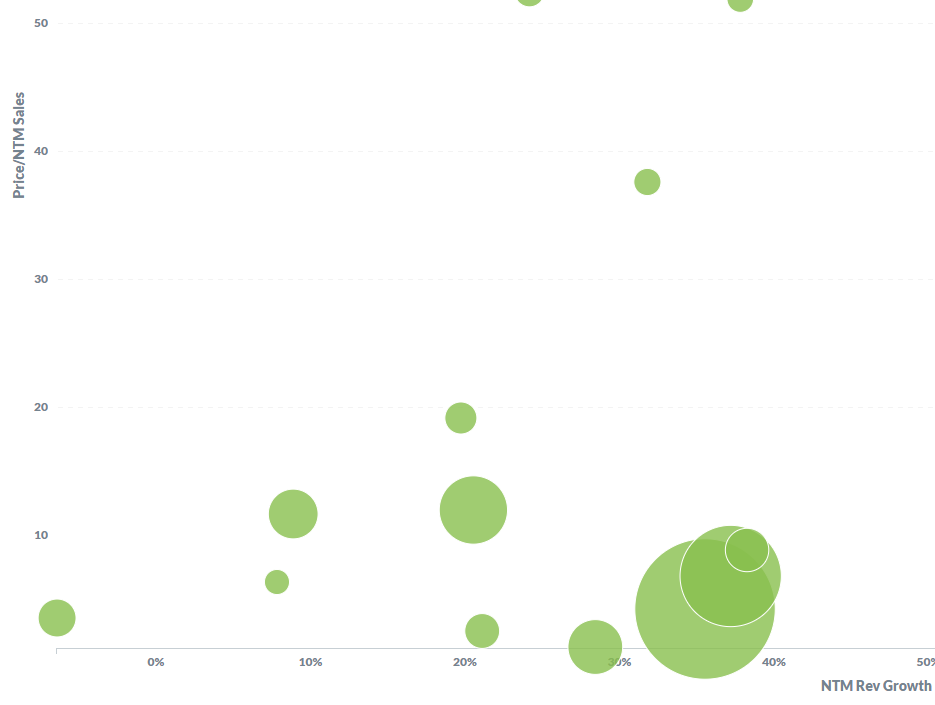
X-axis: value 1 (growth)
Y-axis: value 2 (valuation)
bubble size: value 3 (mkt cap)
Not sure if I'm missing something, but it would be great to display a name of the stock (which I have in a field in my table) either inside or next to the bubble, so it doesn't need mouse-scrolling / hovering to see the values
Anyone any ideas? thanks
 on the first post