Hi!
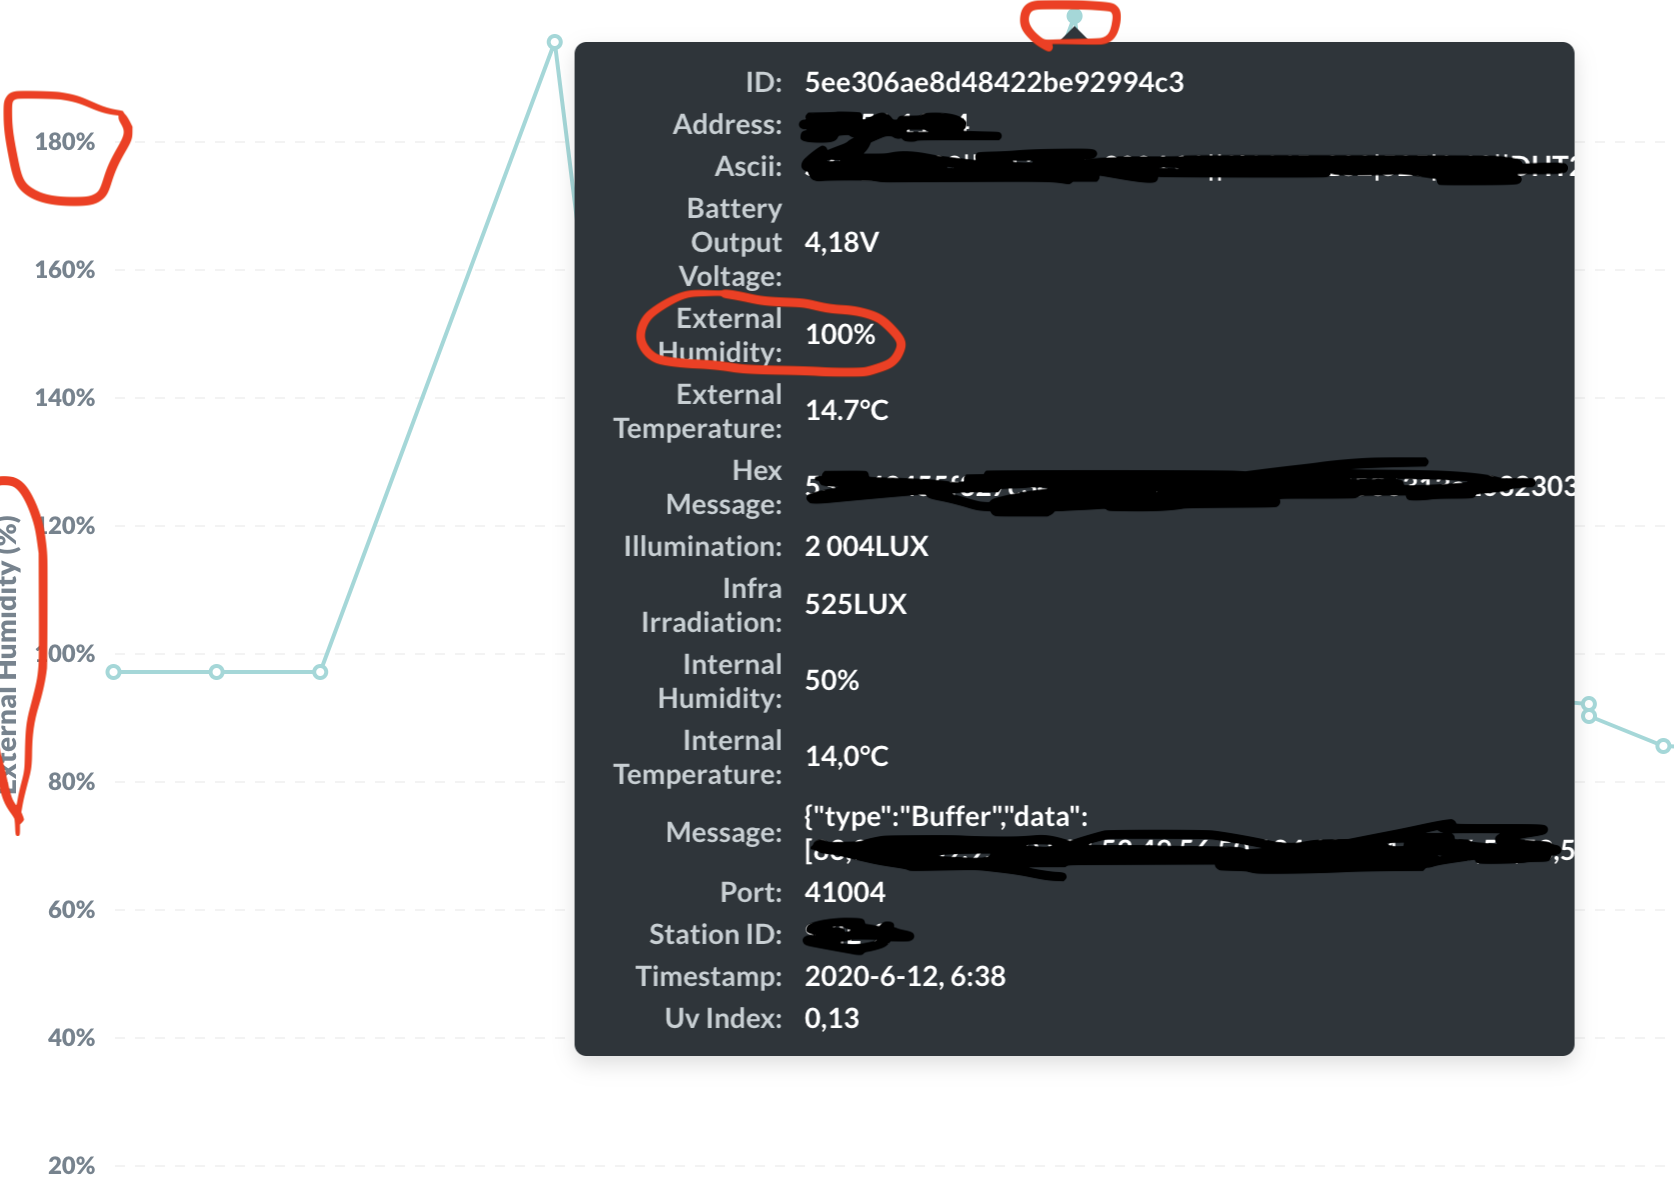
I have different kind of measurements collected in time. When I visualize them, I get 2 incorrect data points put at the wrong value of the y axis. I checked the data itself but it has a smaller value. This is true for all measurements, 2 of these spikes are present at the exact same time. In the attached image you can see the dashboard and the value itself.
{
  "browser-info": {
    "language": "en-GB",
    "platform": "MacIntel",
    "userAgent": "Mozilla/5.0 (Macintosh; Intel Mac OS X 10_15_4) AppleWebKit/537.36 (KHTML, like Gecko) Chrome/83.0.4103.97 Safari/537.36",
    "vendor": "Google Inc."
  },
  "system-info": {
    "file.encoding": "UTF-8",
    "java.runtime.name": "OpenJDK Runtime Environment",
    "java.runtime.version": "11.0.7+10",
    "java.vendor": "AdoptOpenJDK",
    "java.vendor.url": "https://adoptopenjdk.net/",
    "java.version": "11.0.7",
    "java.vm.name": "OpenJDK 64-Bit Server VM",
    "java.vm.version": "11.0.7+10",
    "os.name": "Linux",
    "os.version": "4.4.0-177-generic",
    "user.language": "en",
    "user.timezone": "GMT"
  },
  "metabase-info": {
    "databases": [
      "h2",
      "mongo"
    ],
    "hosting-env": "unknown",
    "application-database": "h2",
    "application-database-details": {
      "database": {
        "name": "H2",
        "version": "1.4.197 (2018-03-18)"
      },
      "jdbc-driver": {
        "name": "H2 JDBC Driver",
        "version": "1.4.197 (2018-03-18)"
      }
    },
    "run-mode": "prod",
    "version": {
      "date": "2020-05-28",
      "tag": "v0.35.4",
      "branch": "release-0.35.x",
      "hash": "b3080fa"
    },
    "settings": {
      "report-timezone": null
    }
  }
}

 on the first post