Hi there, guys!
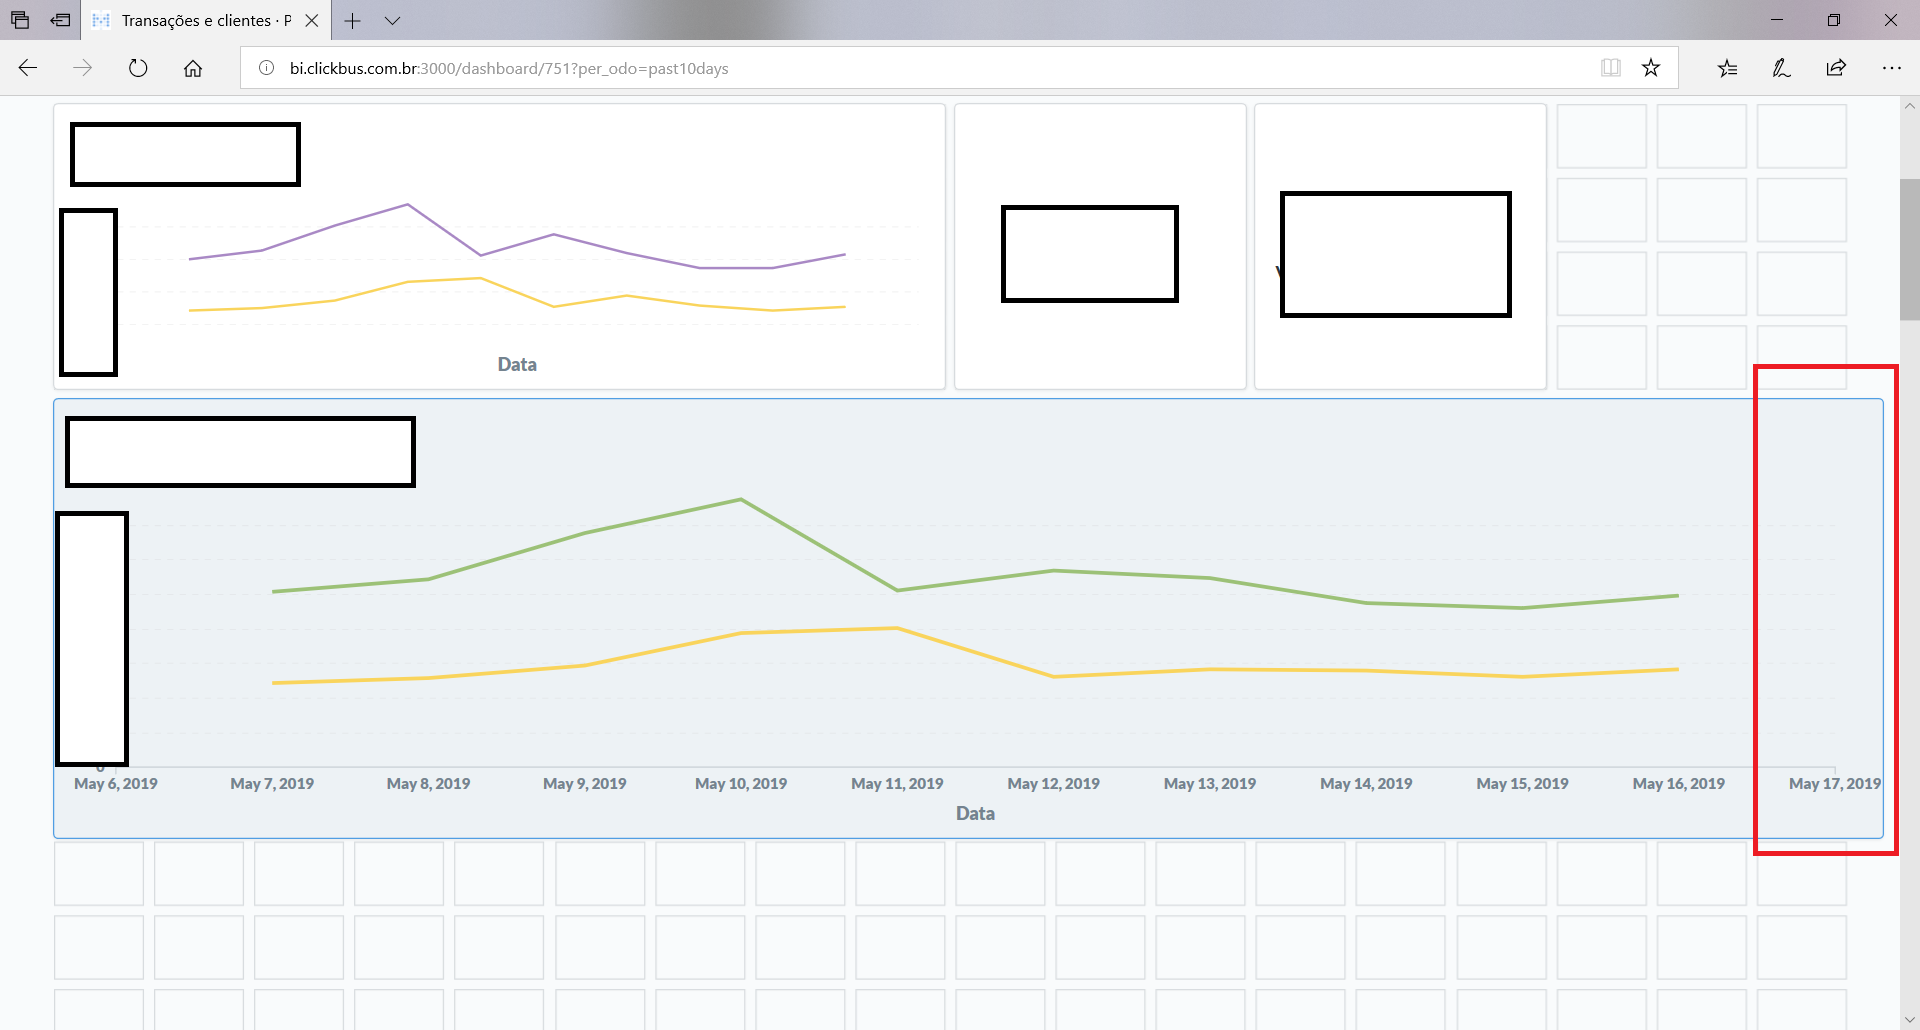
I'm trying to show values by data in a dashboard. The question works finely, but, in dashboard, dates are not being properly shown. In the image below, I'm dragging my mouse and expanding the question a bi beyong the allowed borders of the dashboard grid (as indicated by the red rectangle):
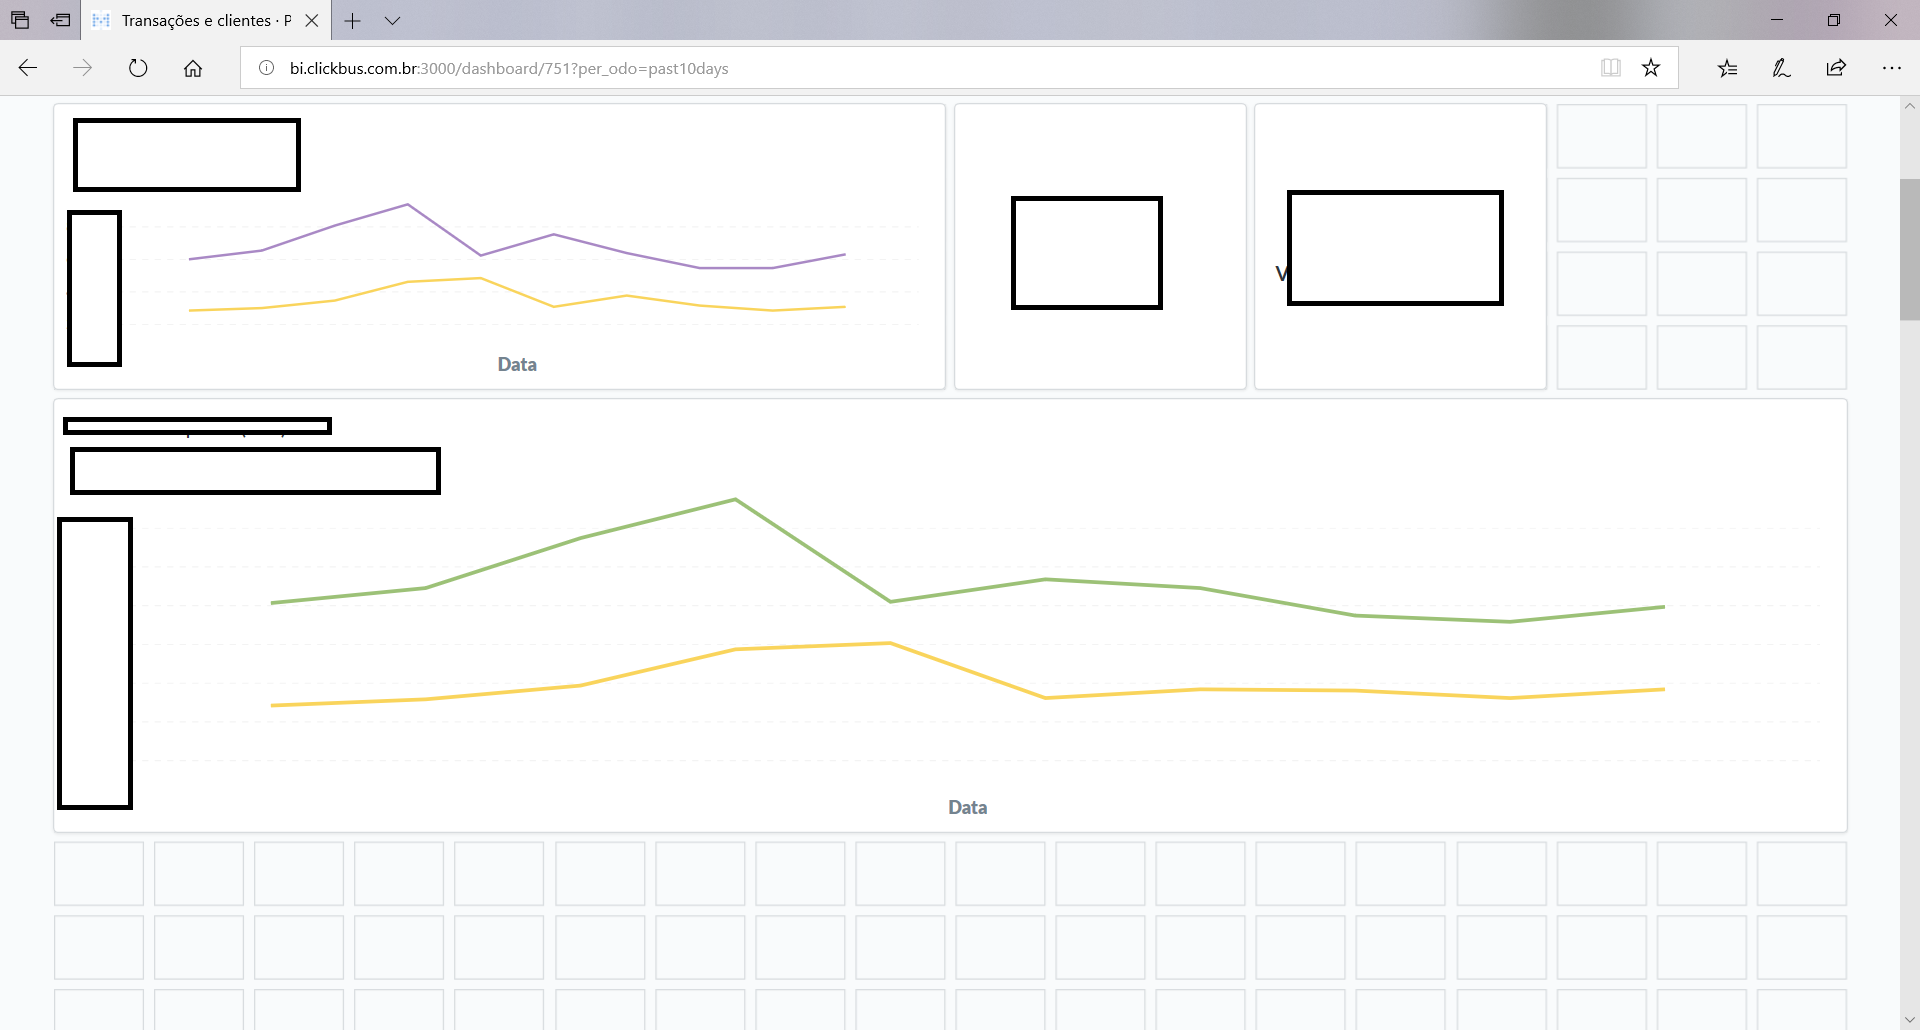
Once I release my mouse drag, the chart fills in once again in the allowed grid, and, then, the dates are not shown:
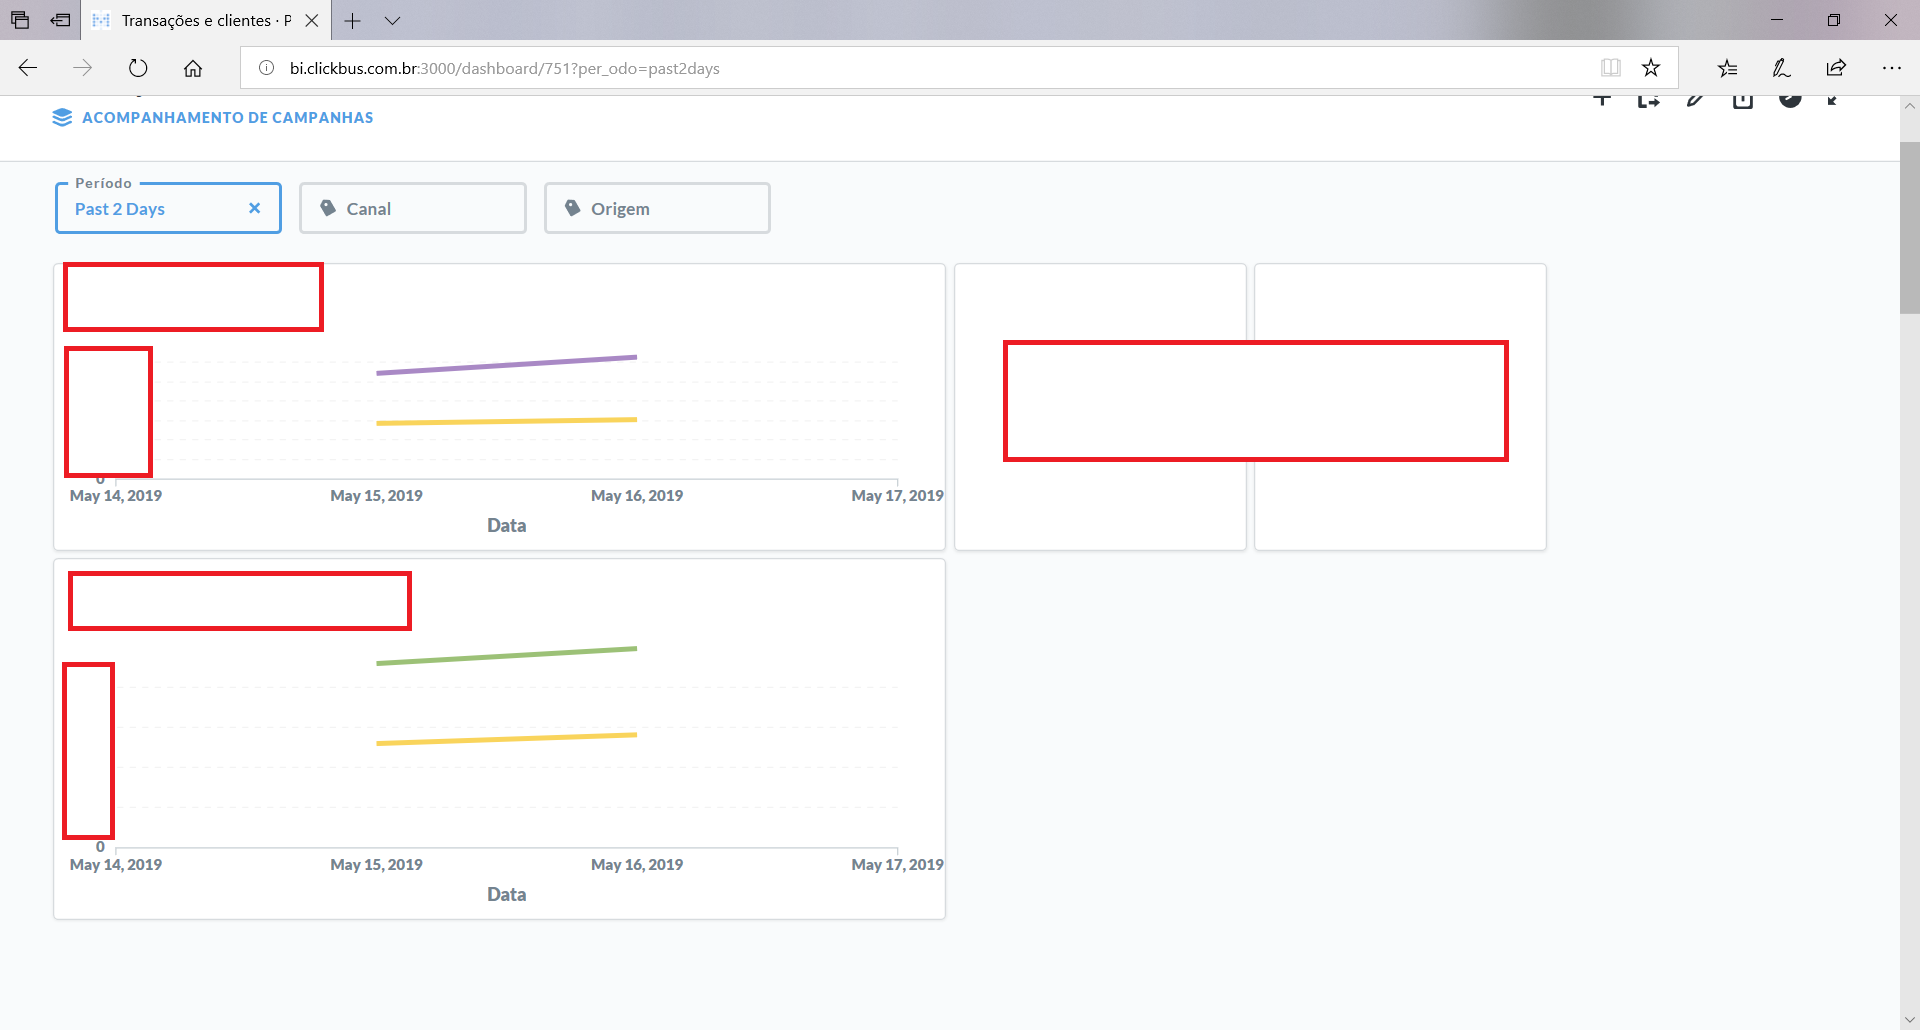
Two things worth mentioning: when I move to a larger monitor, the dates are shown; when I choose a narrower date range, the dates are also shown, even using a much smaller chart size:
Something is definitely off here... I'm using 0.31.0. I could reproduce this on Chrome and Edge. Any thoughts?
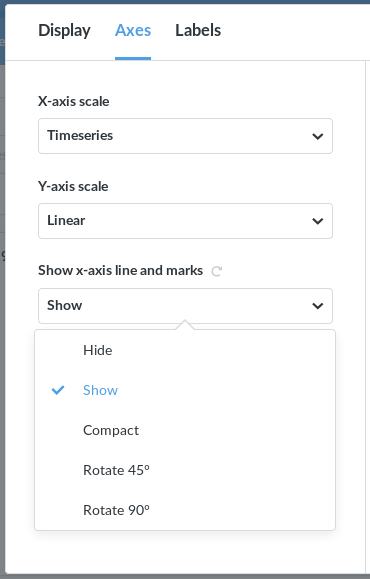
There are some automatic stuff going on, so when the x-axis marks gets over-crowded, then it hides the x-axis completely.
You can modify the behavior by using a different date formatting or by using the x-axis options:
That makes sense, but, in my case, it doesn’t really change anything - I tried all of the available options, and none of them (particularly the “Rotate 90º”, which should show the dates, despite squeezing the cart area itself) resulted in the dates being displayed 
@lucas.lima
Does it make a difference if you choose Ordinal instead of Timeseries in the settings?
I needed to do that with some questions for various reasons (like if there was a jump in the series).
Well, it changes to format to the long date format, but, when resized, date values still won’t show. In my case, there are no time leaps on the data series. I guess I’ll have to live with it, at least for the time being.
@lucas.lima
I remember seeing an issue, when I read all the issues, but I cannot find it.
I can only locate this issue, which is not really related to the amount of marks on the x-axis, but the height of the card:
https://github.com/metabase/metabase/issues/7058
0.31.2 fixed multiple issues with formatting, so you can get shorthand date format.
1 Like