Hi!
Can I plot a graph with 2 variables on Y and X axis? like this:
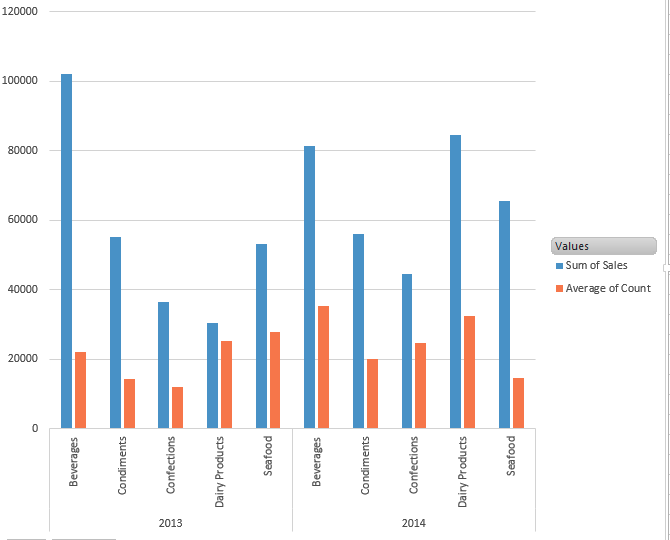
I would like not to repeat the same graph N times on the dashboard hahahaha
Hi!
Can I plot a graph with 2 variables on Y and X axis? like this:
I would like not to repeat the same graph N times on the dashboard hahahaha
Hi @geovani
It looks like it’s adding groupings (sub-dimensions). That is not currently possible.
You’re probably looking for comparison:
https://github.com/metabase/metabase/issues/5606 - upvote by clicking  on the first post
With 0.35, it’s now possible to do some comparison manually:
https://www.metabase.com/blog/Time-Series-Comparisons/index.html
@geovani Searching a bit more, and I think I found the issue you’re looking for:
https://github.com/metabase/metabase/issues/5416 - upvote by clicking on the first post