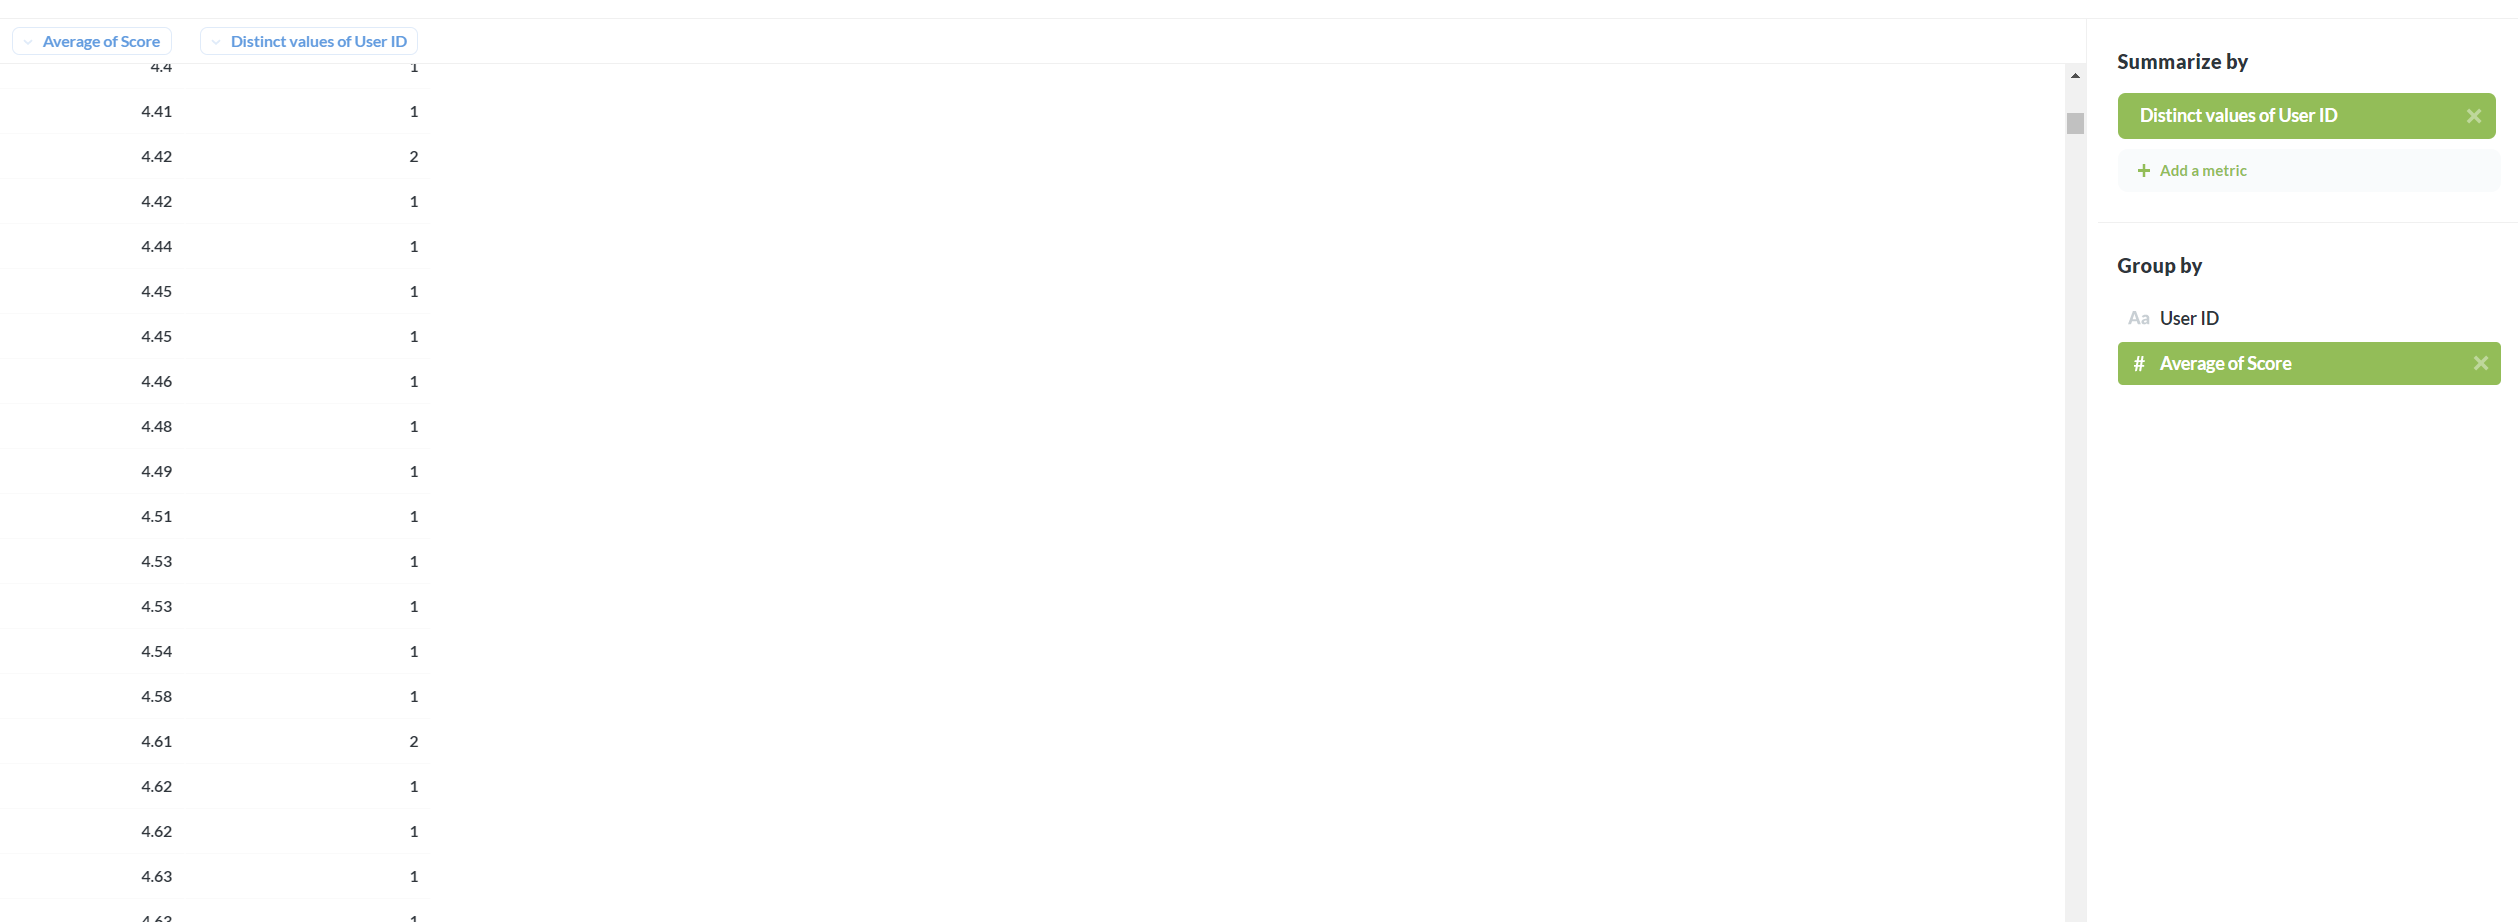
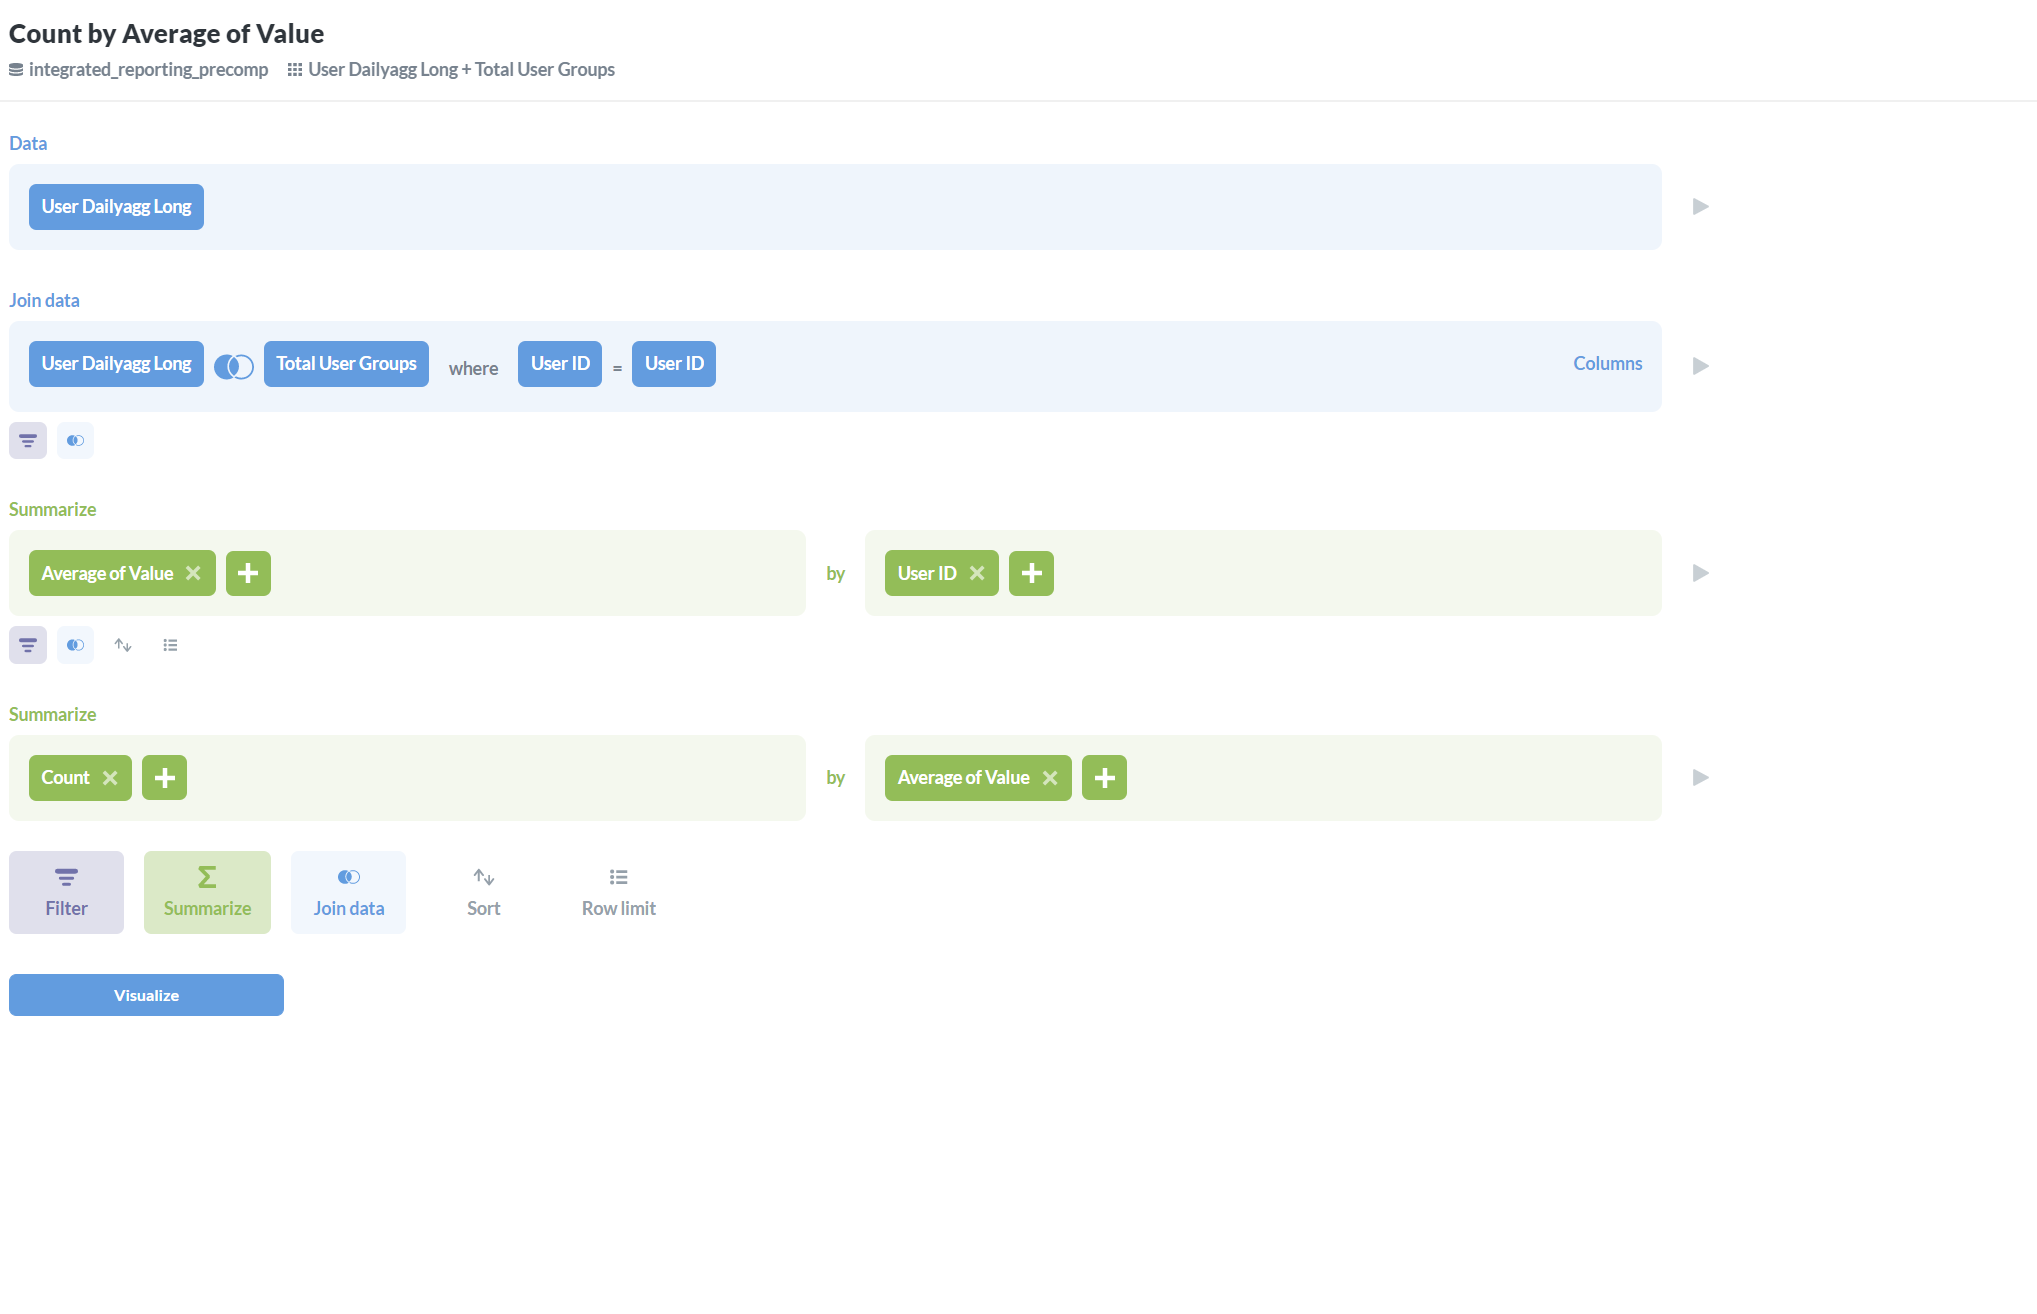
Hi, we've been trying to perform a visualization of double summarized values (Averaged across users, then bucketed by that average and counted). However, the bar charts fail to recognize the continuous valued average as a target for binning.
Hi @Kenneth
Please post “Diagnostic Info” from Admin > Troubleshooting.
Which database are you querying?
Can you post the view from the Notebook - not sure how you have built the question.
Notebook example (similar notebook with the same issues)
Diagnostics
{ "browser-info": { "language": "en-GB", "platform": "Win32", "userAgent": "Mozilla/5.0 (Windows NT 10.0; Win64; x64) AppleWebKit/537.36 (KHTML, like Gecko) Chrome/86.0.4240.183 Safari/537.36", "vendor": "Google Inc." }, "system-info": { "file.encoding": "UTF-8", "java.runtime.name": "OpenJDK Runtime Environment", "java.runtime.version": "11.0.7+10", "java.vendor": "AdoptOpenJDK", "java.vendor.url": "https://adoptopenjdk.net/", "java.version": "11.0.7", "java.vm.name": "OpenJDK 64-Bit Server VM", "java.vm.version": "11.0.7+10", "os.name": "Linux", "os.version": "4.14.186-146.268.amzn2.x86_64", "user.language": "en", "user.timezone": "GMT" }, "metabase-info": { "databases": [ "h2", "bigquery" ], "hosting-env": "unknown", "application-database": "postgres", "application-database-details": { "database": { "name": "PostgreSQL", "version": "11.7" }, "jdbc-driver": { "name": "PostgreSQL JDBC Driver", "version": "42.2.8" } }, "run-mode": "prod", "version": { "date": "2020-10-26", "tag": "v1.37.0.2", "branch": "release-x.37.x", "hash": "7996551" }, "settings": { "report-timezone": null } } }
@Kenneth Okay, I can see what you mean now - I have created an issue (with a possible workaround)
https://github.com/metabase/metabase/issues/13764 - upvote by clicking  on the first post
Thanks, I’ll give that a shot.