Sharing dashboards with a public link that doesn't require a login is something we're actively discussing on GitHub. You can add your support for that feature here.
As for the grayed-out options, Metabase tries to deter you from selecting visualization options that don't seem to make sense for your current table or result-set, but you can still select those options.
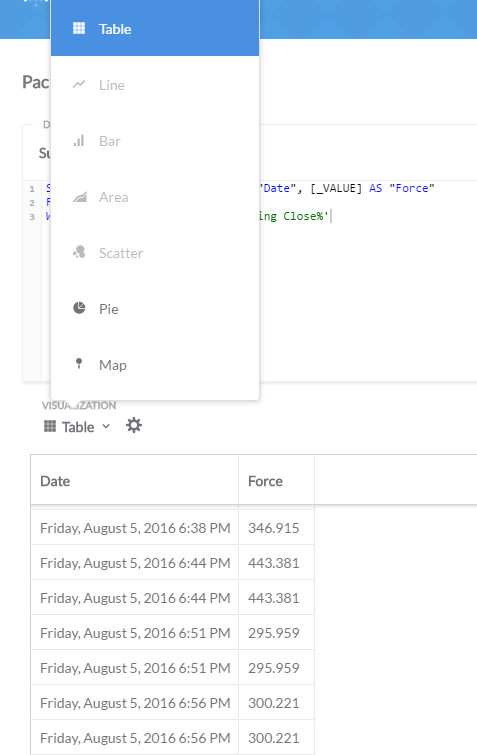
If I select a plot I can set the x axis, but the y axis is greyed out. Only table works.
Do you mean if you open up the chart options for the scatterplot visualization type, the drop-down for the y-axis is grayed-out? If so, this might mean your result table only contains one numeric field. For scatterplots, Metabase expects numeric fields for both the y and x axis.