I have created the below chart.
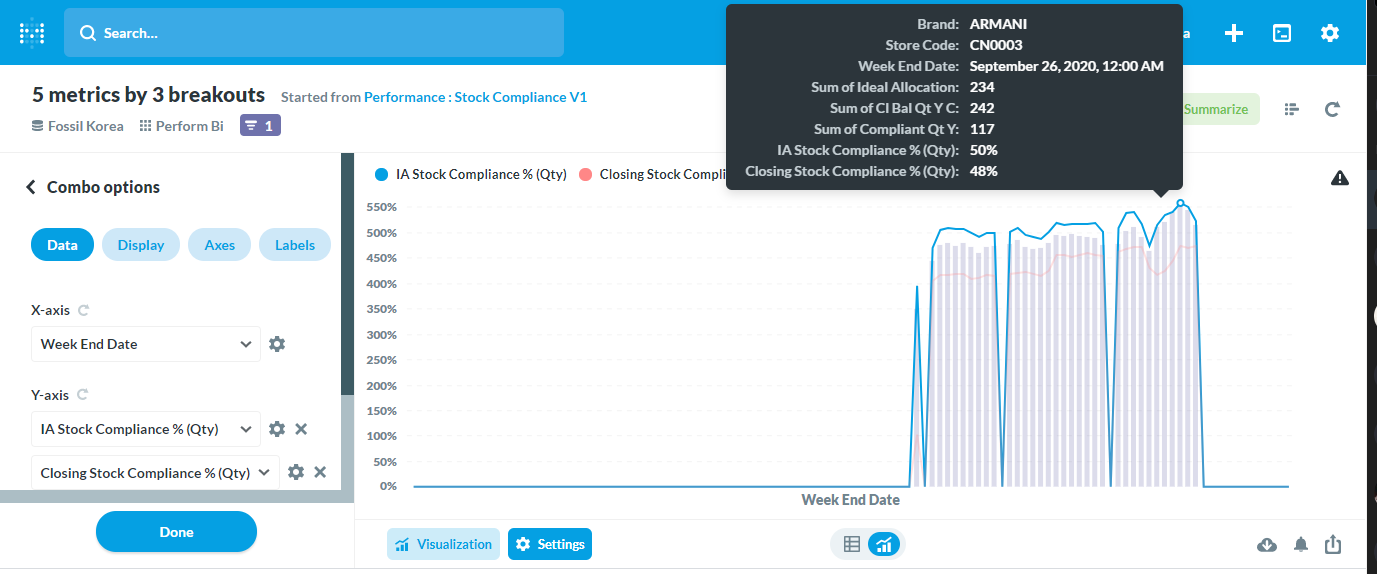
If you look at the tooltip, both the % mesures have max value of 54%. Despite that the x axis shows 550% ....
Not able to figure out which setting is incorrectly set.
Can someone help?
I have created the below chart.
If you look at the tooltip, both the % mesures have max value of 54%. Despite that the x axis shows 550% ....
Not able to figure out which setting is incorrectly set.
Can someone help?
There is one error sign which shows - ‘WeekendDate’ is an unaggrageted field and if it has more than one value it will be summed.
What does this mean? Yes I have more than one records for same weekend date. But if the formaula added for % measure is Sum(x)/sum(y) it should show correct value. Which it is showing in the tooltip. But the y axis is not showing right percent values…
Got the problem. I had data at weekenddate and store level. But on the chart I was not using Store code. That was causing the problem. So removed store from the data grouping. It worked properly now.
Hi @Mohan_Bharatia
Good you found a solution. Sounds like you were seeing this issue:
https://github.com/metabase/metabase/issues/11907 - upvote by clicking  on the first post