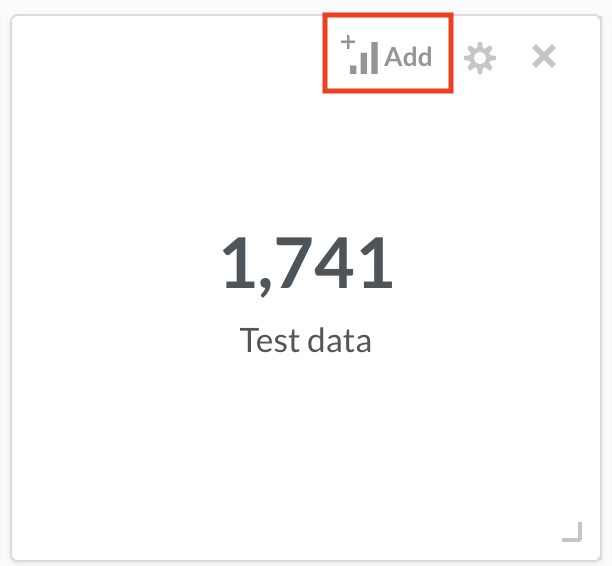
I just updated to Metabase 0.31 and noticed that multi series charting doesn't seem to be working with number visualisations on dashboards. In version 0.30.4, it was possible to add other saved questions to number visualisations in order to create e.g. funnel charts. For some reason, that option isn't available anymore. Would you be able to help with this issue?