My graph is using a MySQL DATE field (i.e. 2017-10-15) as the X-Axis (timescale). When using a 2 Y-Axis line chart, the details mouse over and plot are incorrect. Instead they are showing info for the date prior.
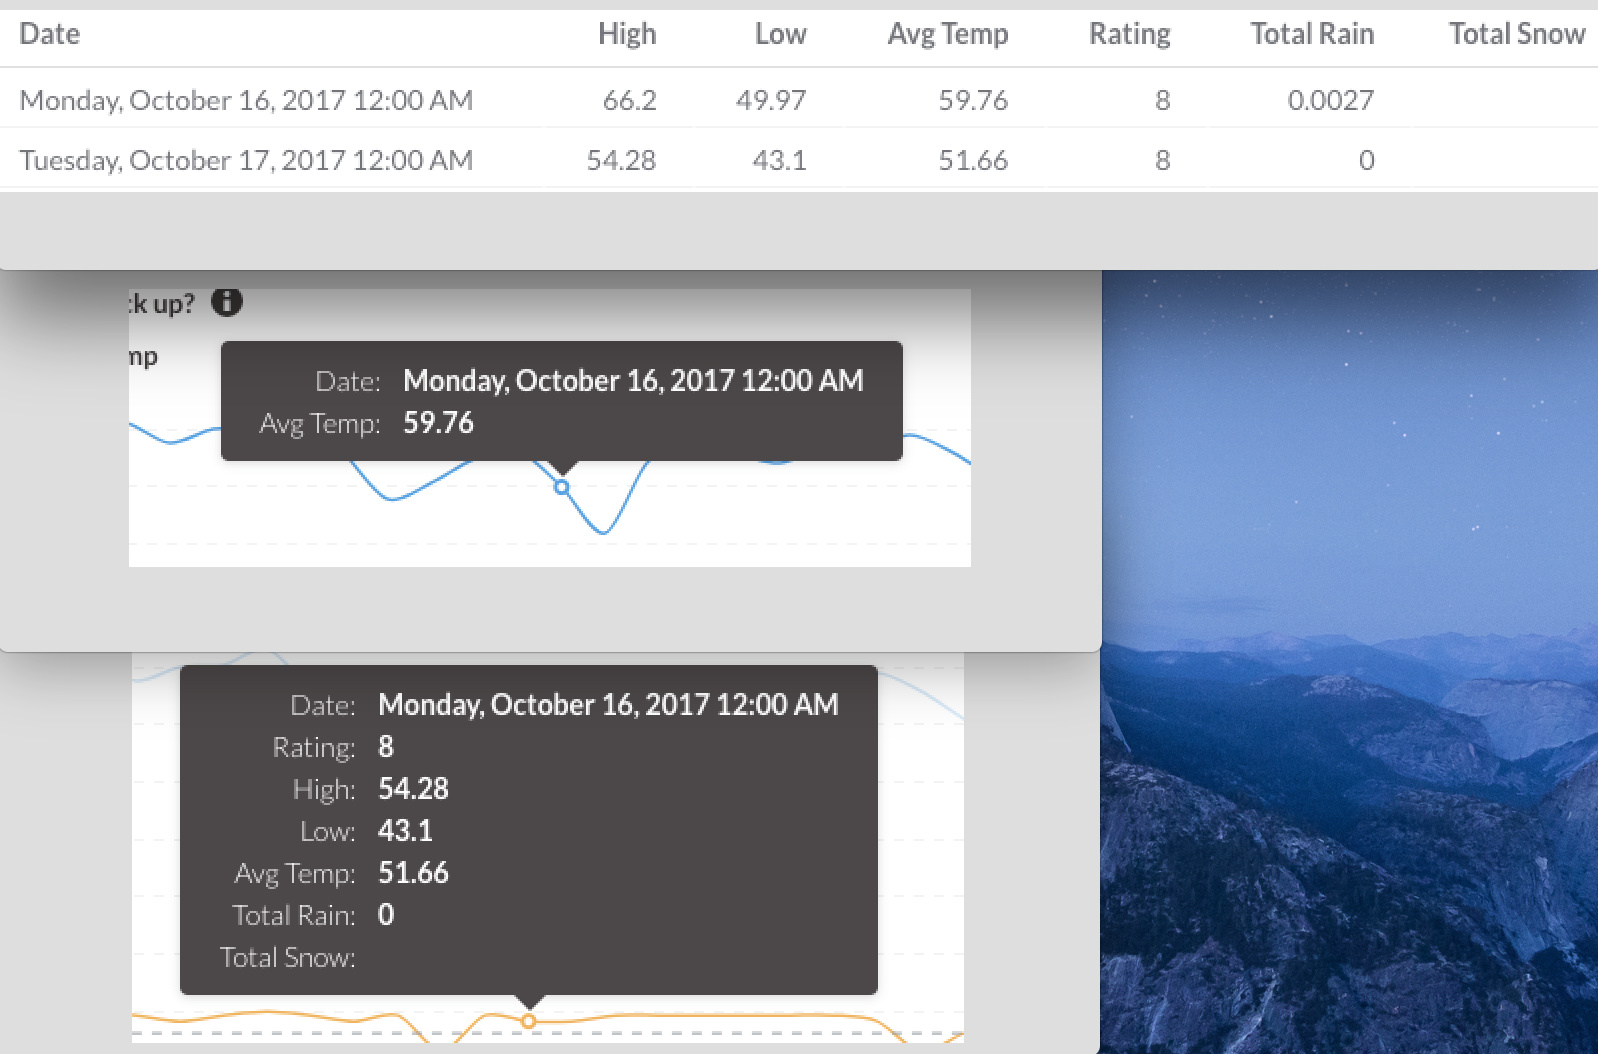
Top picture is the table. This is correct data.
Middle picture is the mouse over for the second Y-Axis and shows the correct date and avg temp.
Bottom picture is the mouse over for the first Y-Axis and shows incorrect data. Notice I'm hovering over Monday Oct 16 but it's showing data from Oct 17 in the mouse over.