The bars on my bar charts often end up 1 pixel wide. Any clues on fattening them up?
In this case the data is grouped on to_char(created_at, 'YYYY-MM-DD') as "Day".
The bars on my bar charts often end up 1 pixel wide. Any clues on fattening them up?
In this case the data is grouped on to_char(created_at, 'YYYY-MM-DD') as "Day".
can you check which version you’re on? I think we fixed this in 0.12.1.
sorry, I’m on 0.12.1
I made progress on this by grouping on date_part('day', current_date - created_at) as "Days old" instead.
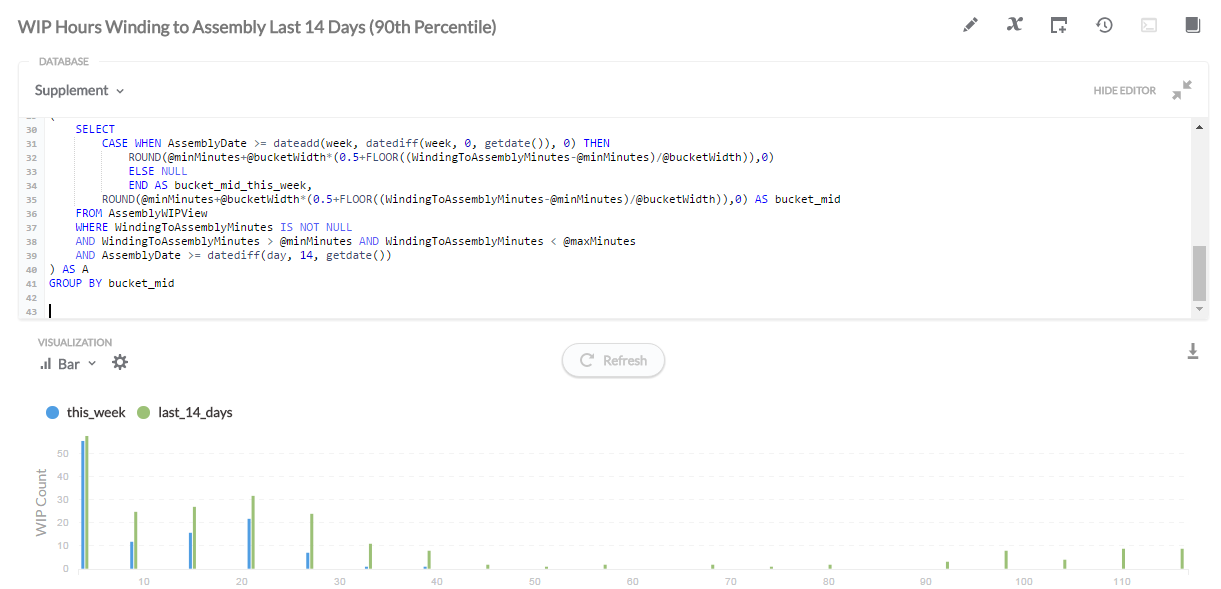
My next problem is that when I generate a bar chart from data that looks like this:
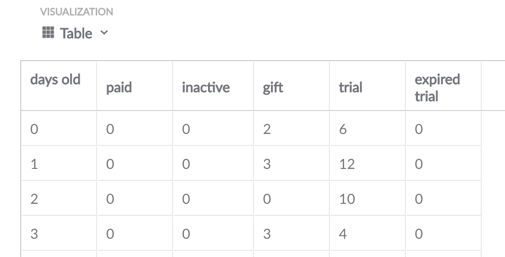
Metabase only charts the first three columns.
Any clues?
p.s. I LOVE your software
Trying to display a histogram… I’m still having the issue with the single pixel bars. Is there any way to increase the bar width??? I’m on v0.20.3
Could you provide some more information about your query and your visualization settings?
Hi Maz, let me know if this information helps. Note that on some other histograms the bar widths are fine so I'm not sure what the difference is.
x-axis=bucket_mid
y-axes=last_14_days, this_week
Both axes are linear, y-axis is set to auto.
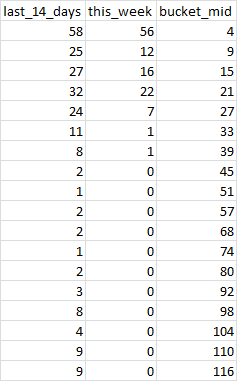
I can't really think of any other settings that would be relevant -? It's pretty much all automatic. Raw data is pasted below.
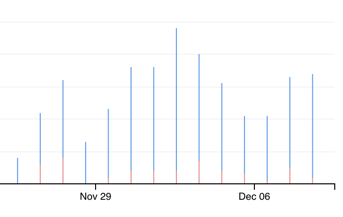
@louloizides , I’ve seen the same issue with the thin bar charts. What I found was that when I had a linear x-axis that contained buckets, like yours does, then the bar char was actually leaving space for the numbers in between, which is why the bars were so thin. For example, in your case, it has a bucket for 4 and 9, but the bars are thin because it has a 0 value for 5, 6, 7, & 8.
You can fix this by changing the x-axis to be ordinal instead of linear, which will cause metabase to not fill in 0 values for the “missing” data.