Metabase is the coolest thing ever. I love that I can easily create visualizations with a lightweight open source tool. Works brilliantly with AWS.
I would love to be able to create a line chart that includes a linear regression trend line in it, based on the data points in the chart. I'd love to be able to tick a box in Metabase that has it automatically fit a trend line to the data points, something like this:
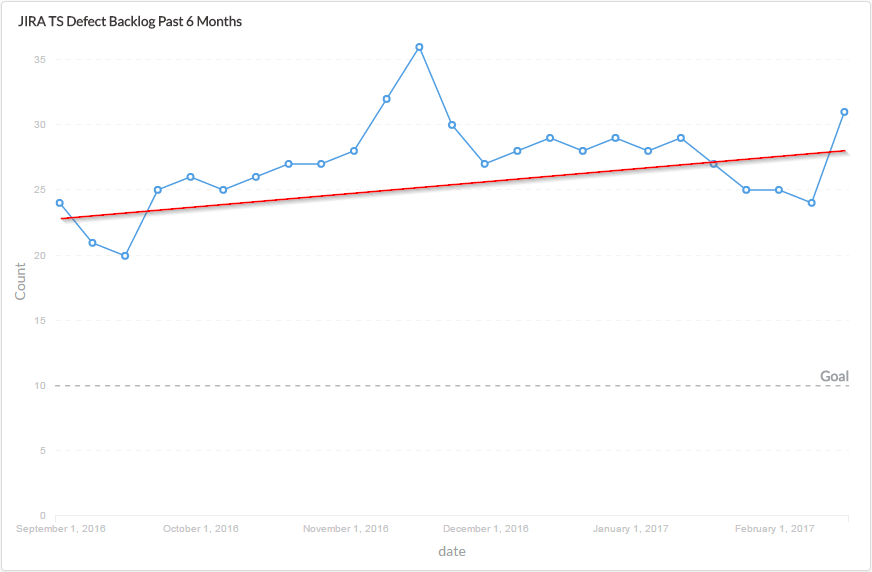
And while I'm asking for stuff for free, could I also suggest an option to make the label text on the axes a darker color? It's really faint on my charts.
Apologies if all this is already available, but I can't find the functionality anywhere ...