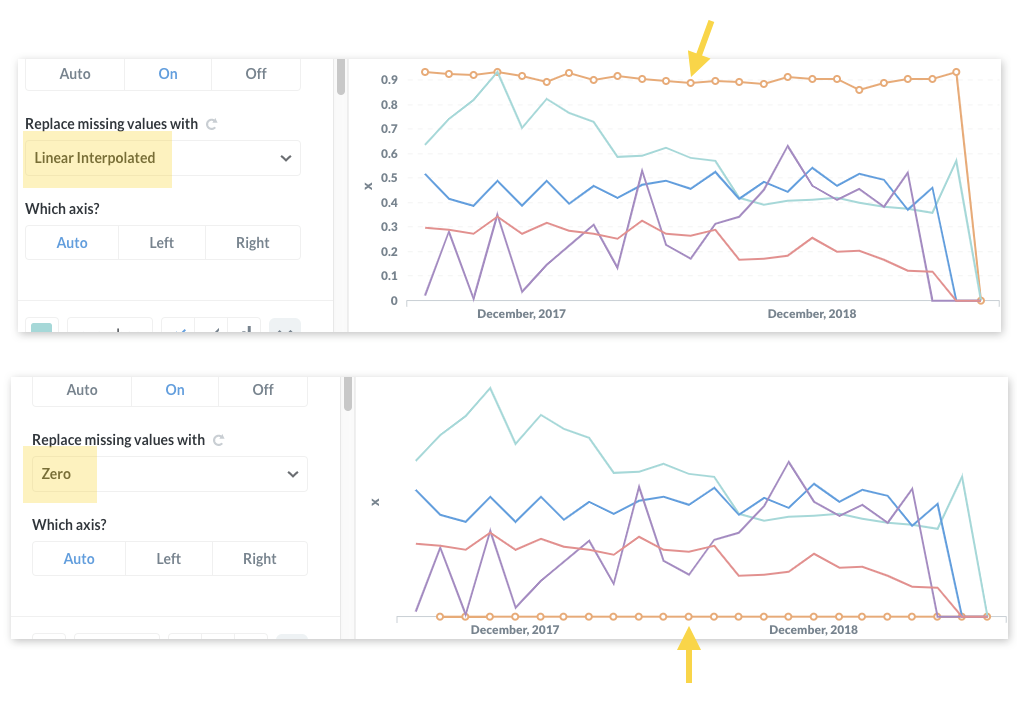
I have a line chart where the y-axis values are null for some dates. When the default 'linear interpolated' is selected, the line chart renders as expected. Selecting either of the other to options no longer works correctly however.
Compare the same chart below where 'Replace missing values with' is set to 'Linear Interpolated' and 'Zero'
Hi @nick_at
There has been several issues fixed since 0.33.0 - could you check if 0.33.2 works?
Otherwise it would be great to have steps to reproduce, so it’s easier to create an issue for it.
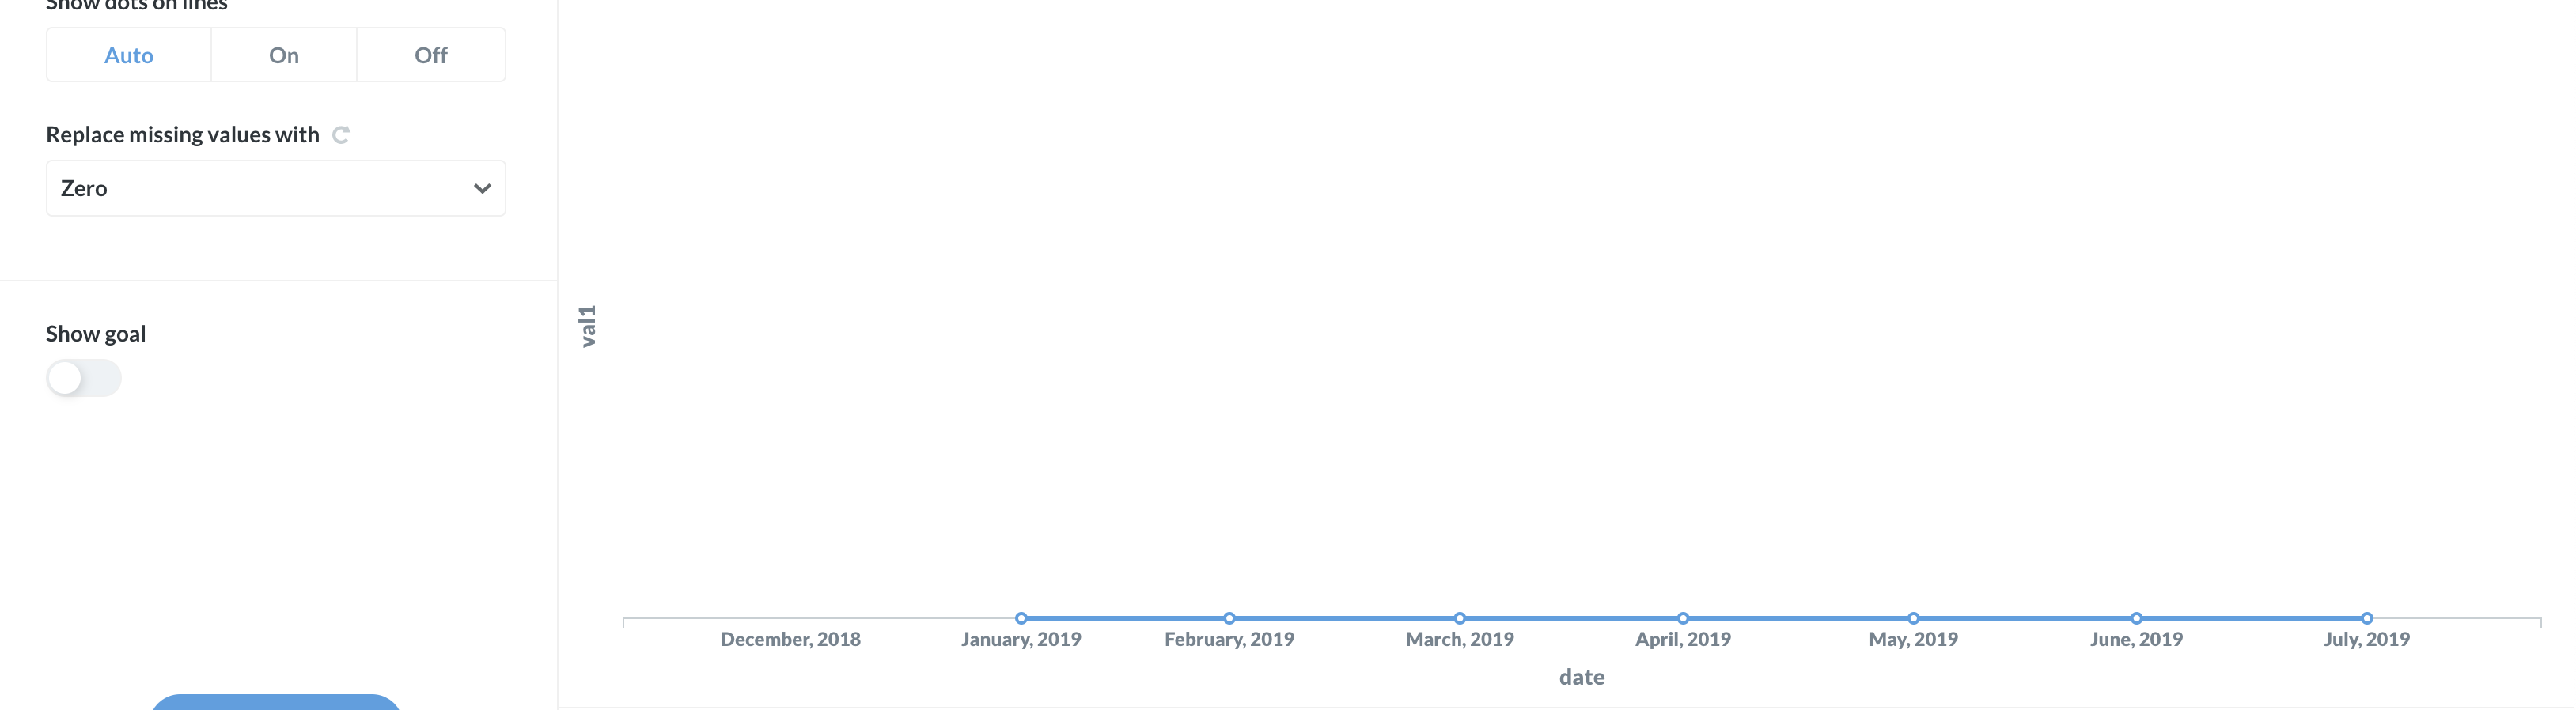
Hey @flamber. We've just upgraded to 0.33.2. I've managed to replicate the issue with some dummy data. The issue appears to exist when the x-axis is a date. When you change it to an integer it works fine.
The below syntax is for a MySQL database:
SELECT '2019-01-01T00:00:00.000Z' AS date,0.67567 AS val1
UNION ALL
SELECT '2019-02-01T00:00:00.000Z' AS date,0.345634567 AS val1
UNION ALL
SELECT '2019-03-01T00:00:00.000Z' AS date,0.24574257 AS val1
UNION ALL
SELECT '2019-04-01T00:00:00.000Z' AS date,0.3462346 AS val1
UNION ALL
SELECT '2019-05-01T00:00:00.000Z' AS date,0.346456 AS val1
UNION ALL
SELECT '2019-06-01T00:00:00.000Z' AS date,0.3457451
UNION ALL
SELECT '2019-07-01T00:00:00.000Z' AS date,0.3463456 AS val1
UNION ALL
SELECT '2019-08-01T00:00:00.000Z' AS date,NULL AS val1
 on the first post: