After installing metabase, I'm starting to love this software but I'm also hitting a few walls. This might be a stupid question but I haven't yet found a way to it the gui, so far.
Given a mongoDB of metrics for software builds how can I tabulate data from just one collection (build) only.
Each collection in the db looks something like:
db.database.find().pretty()
{
"_id" : ObjectId("5d080a131c387759ce1a6b1f"),
"target" : "Build_Target_A",
"build-tag" : "190616",
"date" : "Tue Apr 16 10:11:36 2019",
"hierarchy" : {
"level_1A" : "499.4035",
"level_1B" : "1022168.4899",
"level_1C" : "4616.3981",
"level_1D" : "4517.0497",
"level_1E" : "1229678.3424"
},
"optimization_groups" : {
"grp_1243" : {
"best" : "+0.076",
"sum" : "0",
"counter1" : "0",
"counter2" : "4"
},
"grp_442" : {
"best" : "-13.162",
"sum" : "-6510",
"counter1" : "1665",
"counter2" : "22"
},
"grp_23345" : {
"best" : -107.945,
"sum" : -303250,
"counter1" : 8786,
"counter2" : "32"
}
},
"primitives" : {
"ClassA" : {
"count" : 125444,
"area" : 1017409.32
},
"ClassB" : {
"count" : 365555,
"area" : 6066699.52
},
"ClassC" : {
"count" : 176,
"area" : 1261744.76
}
}
}
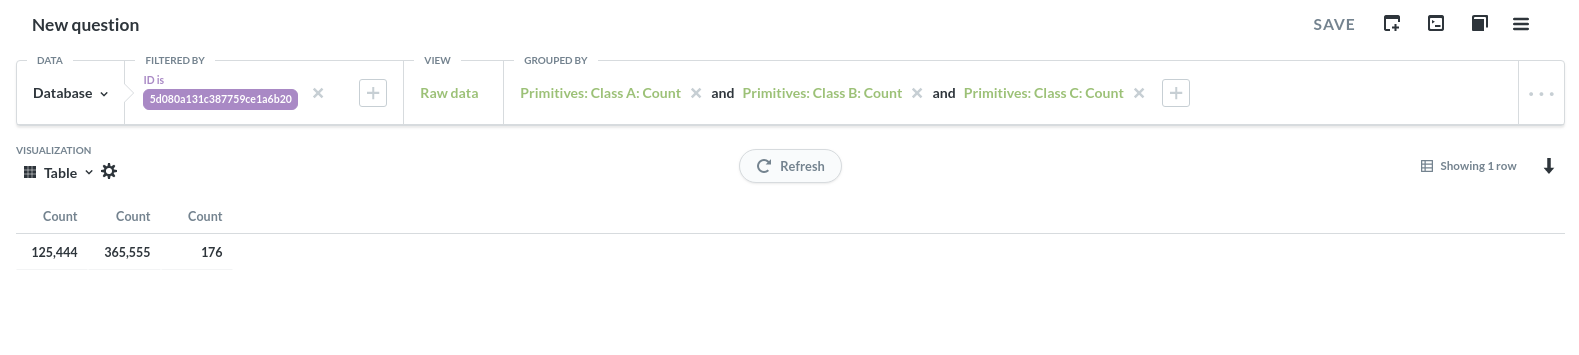
If I filter on an ID, ask for the raw data, and choose a few of the nested elements to show, I get the raw numbers but all three table entries have the same column name ("Count"). Also it doesn't look the row has been named (it should really follow the id, in this example). Hence, I can't really apply any visualization.
If this is a GUI limitation, is there a good reference for writing the queries in the native format (mongoDB in my case)?
Alternatively, Is there a better schema for the input, maybe?