Hi,
I have a lot of measurement-data from the past 40 years (water-levels of different rivers).
Sadly, the people who use and collected this data have some inconsistent data:
Because of rounding-errors and incomplete import-scripts there a a lot of data for same date and time, but slightly different measurement-values. I have no possibility to update or delete rows.
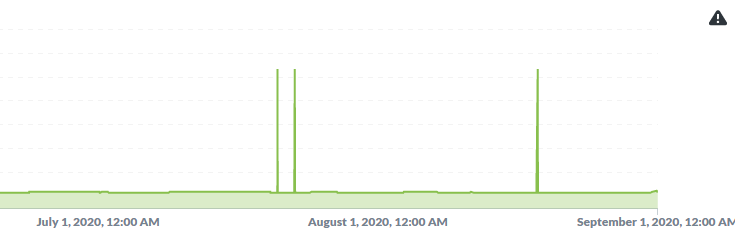
If I plot a graph via metabase, the error-triangle "unaggregated field" shows up in the question:
For the same date and time, the values are summarized. If I hover over the data-point, a single value is shown (not the sum).
We need the graph without summarized the values of same date+time.
My first idea was, to select the average-value of each single time-step of the data. So, if same-timesteps exists, the graph doesn't show the sum, but the average-value.
Does somebody know, how you can calculate and show this average for every timestep in a graph in metabase, so the peaks are gone?
I tried this:
SELECT gwpflumw_datetime, AVG(gwpflumw_deviceValue), gwpflumw_deviceID
FROM gwpflumw, gwpflumst
WHERE {{category}} AND {{datum}}
GROUP BY gwpflumw_datetime, gwpflumw_deviceValue, gwpflumw_deviceID
Background-info: example of the data:
gwpflumw_deviceID      gwpflumw_deviceValue         gy_datetime
8191                         112,56             2020-07-29 17:00:00
8191                         112,40             2020-07-29 17:05:00
8191                         112,52             2020-07-29 17:10:00
8191                         112,50             2020-07-29 17:15:00
8191                         112,60             2020-07-29 17:15:00
Should be interpreted like (change at the last two rows):
gwpflumw_deviceID      gwpflumw_deviceValue         gy_datetime
8191                         112,56             2020-07-29 17:00:00
8191                         112,40             2020-07-29 17:05:00
8191                         112,52             2020-07-29 17:10:00
8191                         112,55             2020-07-29 17:15:00
 on the first post