Hi,
I'm trying to create a stacked chart of merchant summary totals based on date.
no matter what I metabase shows the graph total but will never show the stacks.even though I am setting chart to be stacked.
couldn't find any information on how to set this up correctly.
Help please.
Ariel
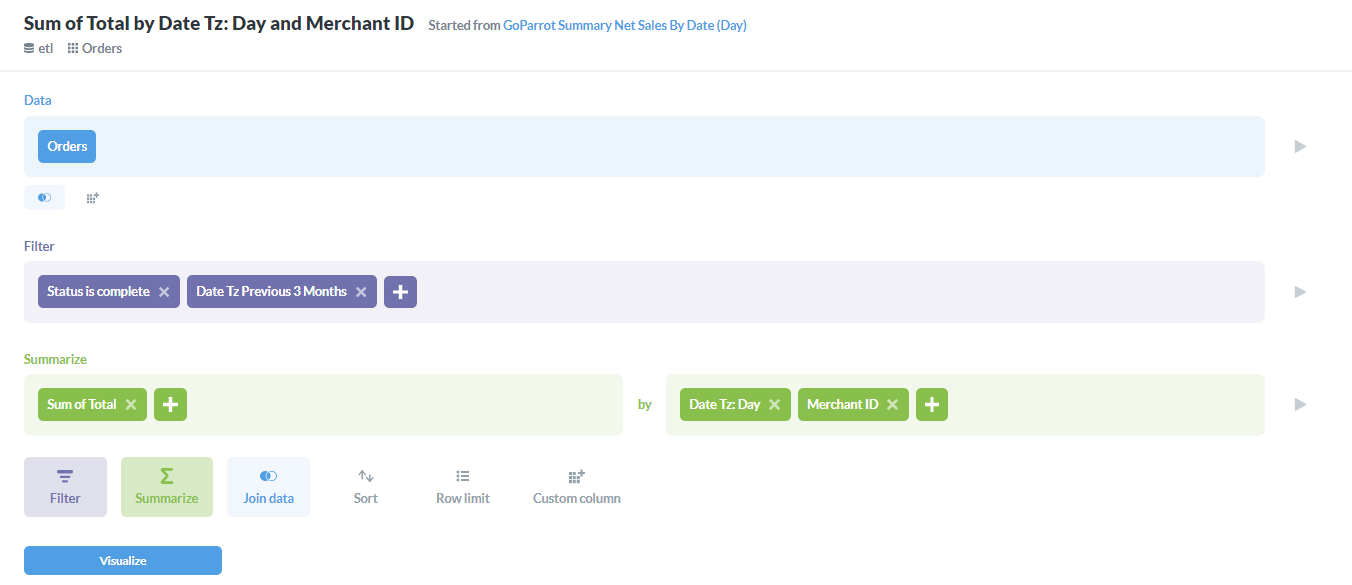
What are your visualisation option?
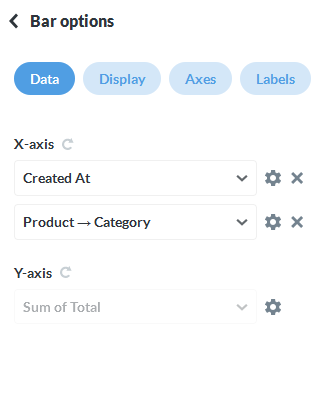
oh, ok. got it. that's what i was missing. the additional x-axis.
Thanks so much for the quick response.
Unfortunately when i set that i ran into the next problems which is that i have more than 20 series of data.
Is there anyway around this?

REduce the number of merchants or date groups.