Hi @flamber
Thanks for your help
{
  "browser-info": {
    "language": "fr-FR",
    "platform": "MacIntel",
    "userAgent": "Mozilla/5.0 (Macintosh; Intel Mac OS X 10_14_6) AppleWebKit/537.36 (KHTML, like Gecko) Chrome/81.0.4044.122 Safari/537.36",
    "vendor": "Google Inc."
  },
  "system-info": {
    "file.encoding": "UTF-8",
    "java.runtime.name": "OpenJDK Runtime Environment",
    "java.runtime.version": "11.0.5+10",
    "java.vendor": "AdoptOpenJDK",
    "java.vendor.url": "https://adoptopenjdk.net/",
    "java.version": "11.0.5",
    "java.vm.name": "OpenJDK 64-Bit Server VM",
    "java.vm.version": "11.0.5+10",
    "os.name": "Linux",
    "os.version": "4.14.138+",
    "user.language": "en",
    "user.timezone": "UTC"
  },
  "metabase-info": {
    "databases": [
      "druid",
      "h2"
    ],
    "hosting-env": "unknown",
    "application-database": "postgres",
    "application-database-details": {
      "database": {
        "name": "PostgreSQL",
        "version": "11.6"
      },
      "jdbc-driver": {
        "name": "PostgreSQL JDBC Driver",
        "version": "42.2.8"
      }
    },
    "run-mode": "prod",
    "version": {
      "date": "2020-04-10",
      "tag": "v0.35.2",
      "branch": "release-0.35.x",
      "hash": "f3b2857"
    },
    "settings": {
      "report-timezone": null
    }
  }
}
sample of metabase log request
Jetty threads: 2/50 (4 idle, 0 queued)
Jetty threads: 2/50 (4 idle, 0 queued)
Jetty threads: 2/50 (4 idle, 0 queued)
Jetty threads: 2/50 (4 idle, 0 queued)
Jetty threads: 2/50 (4 idle, 0 queued)
Jetty threads: 2/50 (4 idle, 0 queued)
Jetty threads: 2/50 (4 idle, 0 queued)
Jetty threads: 2/50 (4 idle, 0 queued)
Jetty threads: 2/50 (4 idle, 0 queued)
Jetty threads: 2/50 (4 idle, 0 queued)
Jetty threads: 2/50 (4 idle, 0 queued)
Jetty threads: 2/50 (4 idle, 0 queued)
Jetty threads: 2/50 (4 idle, 0 queued)
Jetty threads: 2/50 (4 idle, 0 queued)
Jetty threads: 2/50 (4 idle, 0 queued)
Jetty threads: 2/50 (4 idle, 0 queued)
Jetty threads: 2/50 (4 idle, 0 queued)
Jetty threads: 2/50 (4 idle, 0 queued)
pod information
Name:               metabase-toto-b7c8b5f66-gxzgg
Namespace:          toto
Priority:           0
PriorityClassName:  <none>
Node:               toto-43ab2c32-fw9j/10.2.0.76
Start Time:         Fri, 24 Apr 2020 13:09:12 +0200
Labels:             app=metabase
                    pod-template-hash=b7c8b5f66
                    release=metabase-toto
                    service=metabase
Status:             Running
IP:                 10.2.66.47
Controlled By:      ReplicaSet/metabase-toto-b7c8b5f66
Containers:
  metabase:
    Container ID:   docker://9c70ae80134afbcd23d58325ce127eb4300ee3383c530622b670f98b9ae005bb
    Image:          metabase/metabase:v0.35.2
    Image ID:       docker-pullable://metabase/metabase@sha256:f95f3dc765164b5126a6f076c8864410d2948651625e8064f4057836d183349f
    Port:           3000/TCP
    Host Port:      0/TCP
    State:          Running
      Started:      Fri, 24 Apr 2020 13:09:21 +0200
    Ready:          True
    Restart Count:  0
    Limits:
      cpu:     2
      memory:  6Gi
    Requests:
      cpu:      2
      memory:   6Gi
    Liveness:   http-get http://:3000/ delay=120s timeout=30s period=10s #success=1 #failure=6
    Readiness:  http-get http://:3000/ delay=20s timeout=3s period=5s #success=1 #failure=3
    Environment:
      MB_JETTY_HOST:           0.0.0.0
      MB_JETTY_PORT:           3000
      MB_DB_TYPE:              postgres
      MB_DB_HOST:              *******
      MB_DB_PORT:              5432
      MB_DB_DBNAME:            metabase
      MB_DB_USER:              <set to the key 'username' in secret 'metabase-totoo-database'>  Optional: false
      MB_DB_PASS:              <set to the key 'password' in secret 'metabase-toto-database'>  Optional: false
      MB_PASSWORD_COMPLEXITY:  normal
      MB_PASSWORD_LENGTH:      12
      JAVA_TIMEZONE:           UTC
      JAVA_OPTS:               -Xmx4G
      MB_EMOJI_IN_LOGS:        false
    Mounts:
      /var/run/secrets/kubernetes.io/serviceaccount from default-token-pmtc4 (ro)
Conditions:
  Type              Status
  Initialized       True
  Ready             True
  ContainersReady   True
  PodScheduled      True
Volumes:
  default-token-pmtc4:
    Type:        Secret (a volume populated by a Secret)
    SecretName:  default-token-pmtc4
    Optional:    false
container are plenty of cpu and memory using less of 50% of requested resources.
As a said, I have the same issue behind or communicating directly with the container so it comes from metabase. Maybe a misconfiguration. I have the exactly same behaviour using production environment or a dev environment without any load.
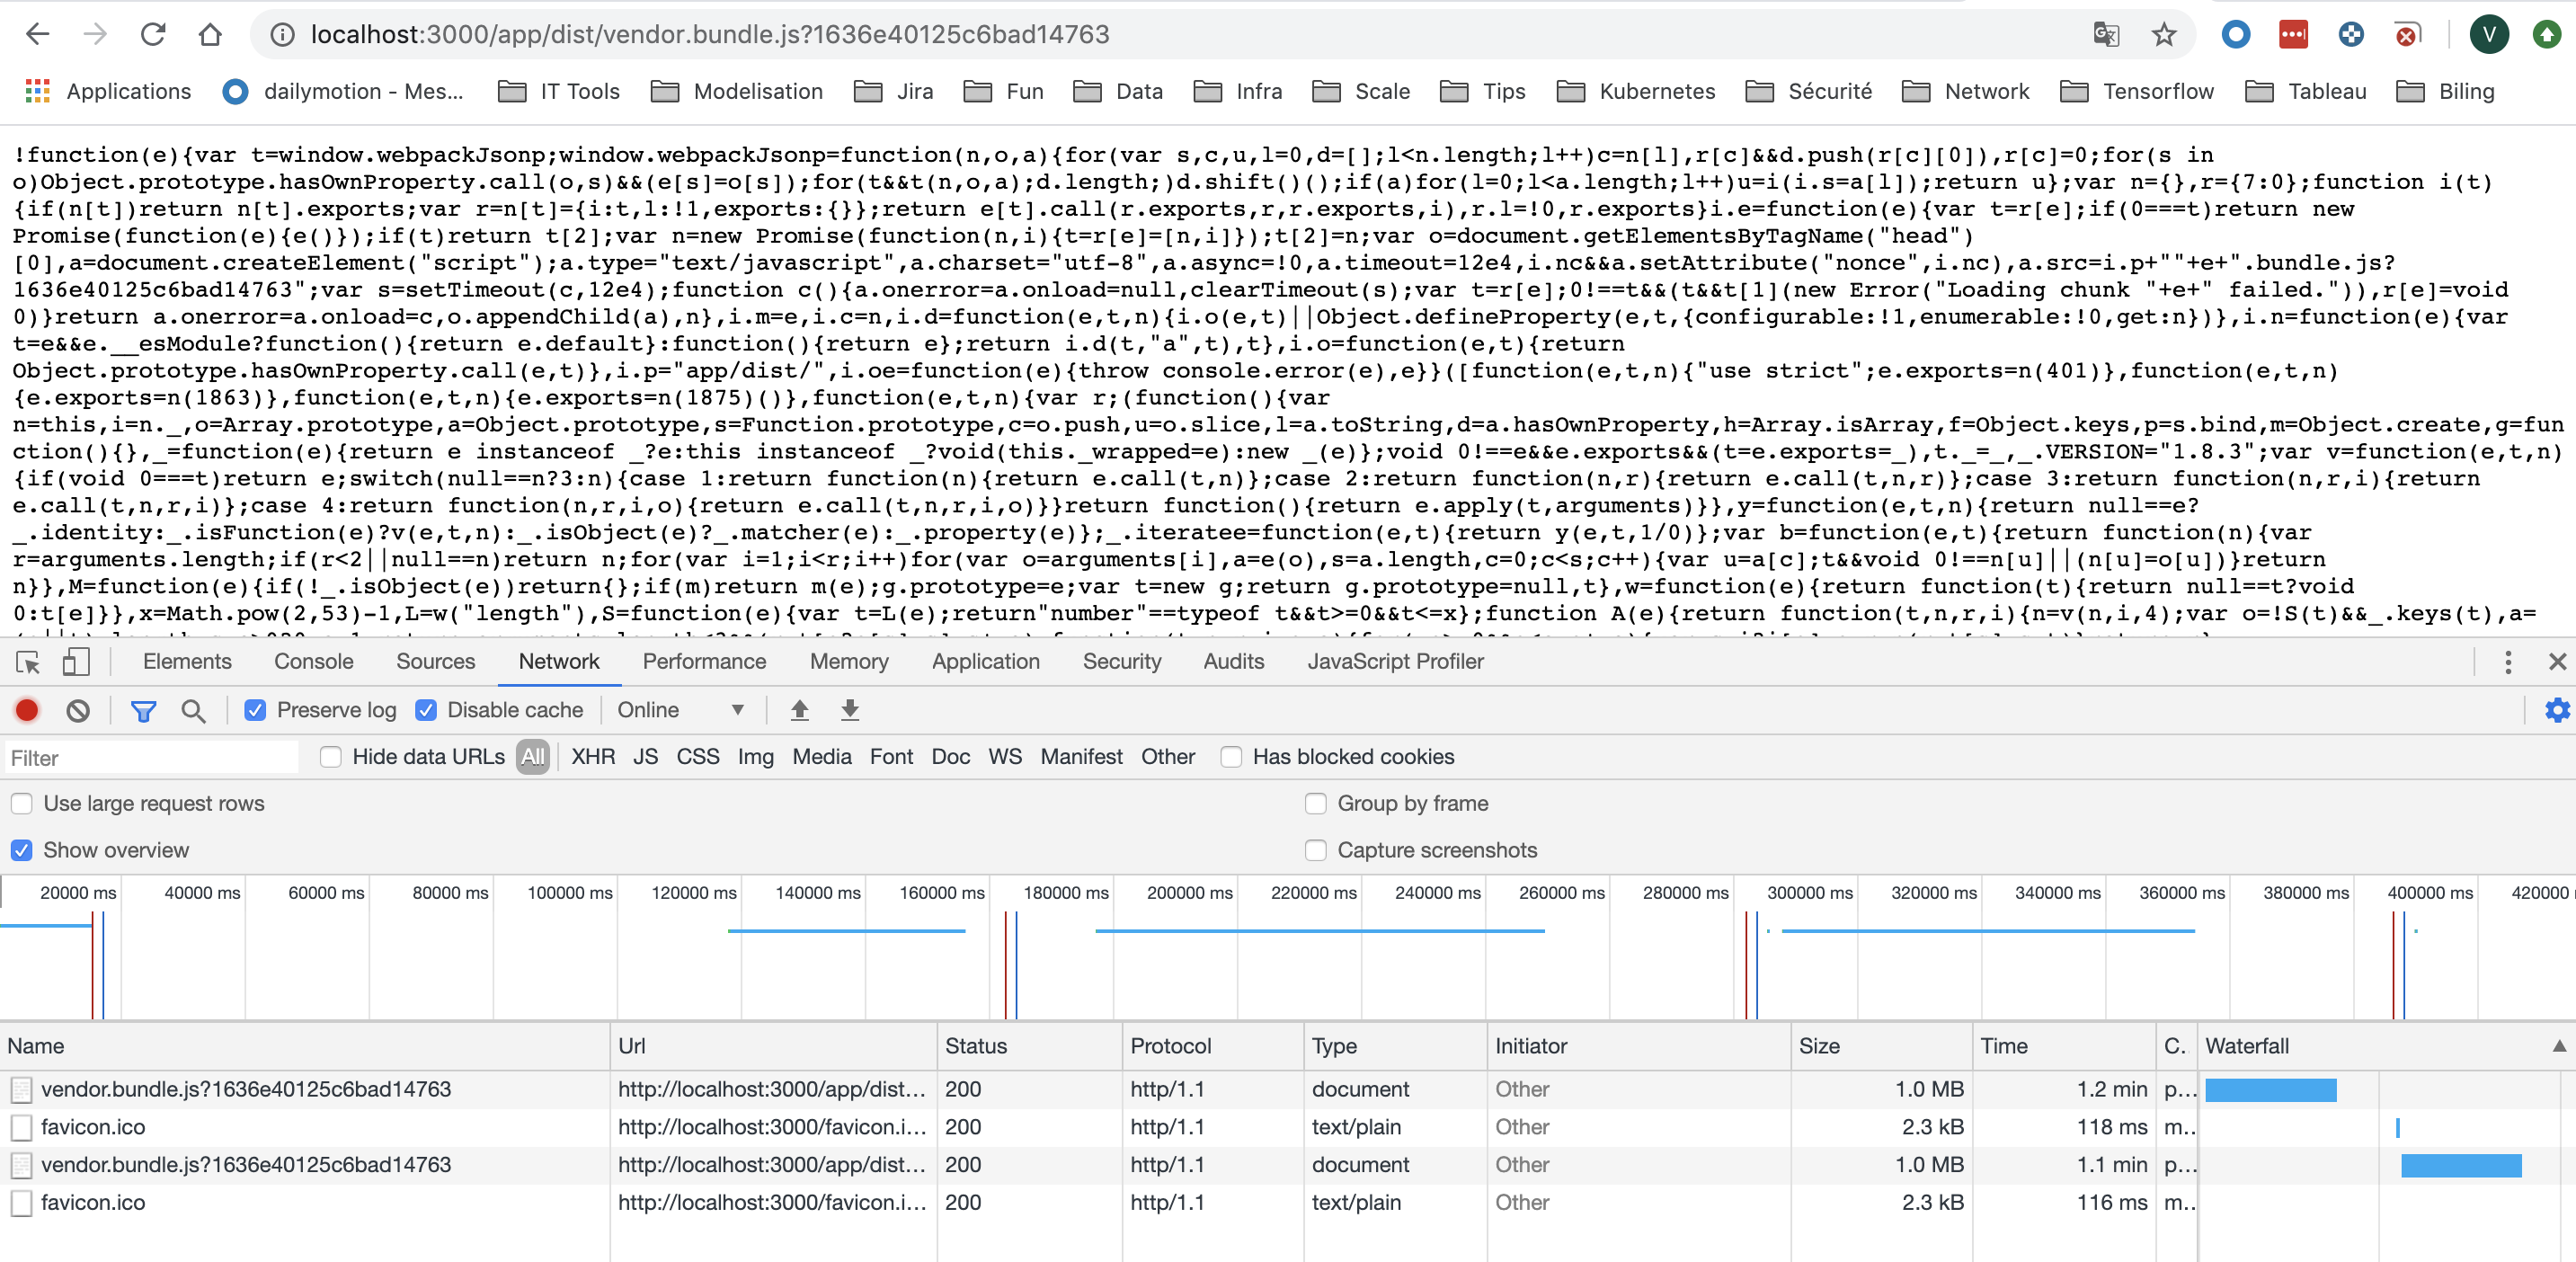
Look at my chrome console I have reloaded the page twice. I have a very good internet speed 150 Mbps and the server are in US and me in EU but still not explain those crazy load time.