Hi ,
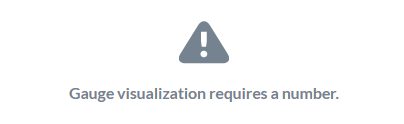
Any Druid / Json expert here? I try to create gauge chart with native query but it keep show me "Gauge visualization requires a number". Custom query for average work but will auto filter out 0 which i wish to included in. I tried to keep average column visible only but also no luck
Below is my query details:-
{"intervals":["2018-01-01T00:00:00+08:00/2019-01-01T00:00:00+08:00"],
"granularity":"all","
context":{"timeout":60000,
"queryId":"3240337f-7991-4889-a28e-a9378cdb612d"},
"queryType":"timeseries",
"dataSource":"ticket_details",
"aggregations":[
 {"type":"filtered",
	"filter":{"type":"not", "field":{"type":"selector","dimension":"booking_period"}},
"aggregator":
    {"type":"count", "name":"rows"}},
    {"type":"longSum","name":"total", "fieldName":"booking_period"}],
    "postAggregations":[
        {"type":"arithmetic",
        "name":"avg",
        "fn":"/",
        "fields":[
            {"type": "fieldAccess","fieldName":"total"},
            {"type":"fieldAccess","fieldName":"rows"}
            ]
        }
    ]
}
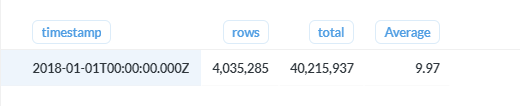
Result:-