This is more of an SQLite question, maybe some experts out there who might just pop a suggested method.
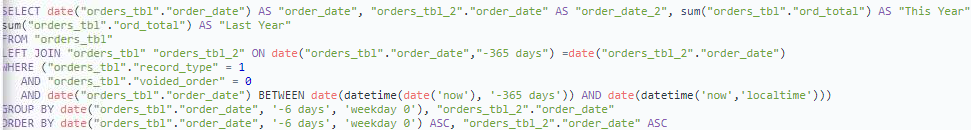
Here is my trial code that just locks up the database infinitely
I want a column of this year's weeks, a second column of sales totals per week of this year, and a third column of the same, for last year.
suggestions appreciated,
Chuck
I’m not a SQLite expert, but I’ve got a lot of Oracle, SQL Server, MySQL, etc. experience. 1) is there an index on order_date? 2) how many rows in Orders? 3) Putting a function around order_date will in many databases disable index usage. Why the date(“orders_tbl_2”.“order_date”) ? I would think that column is already a date. If it is, then the function is not needed and probably not helping.
blaplante,
thanks for the response.
- the order_date is an indexed field
- orders has about 50,000 rows. each row represents an order placed, on a given date. The field order_entry_date is a year, month, day format and one would see with the date() function
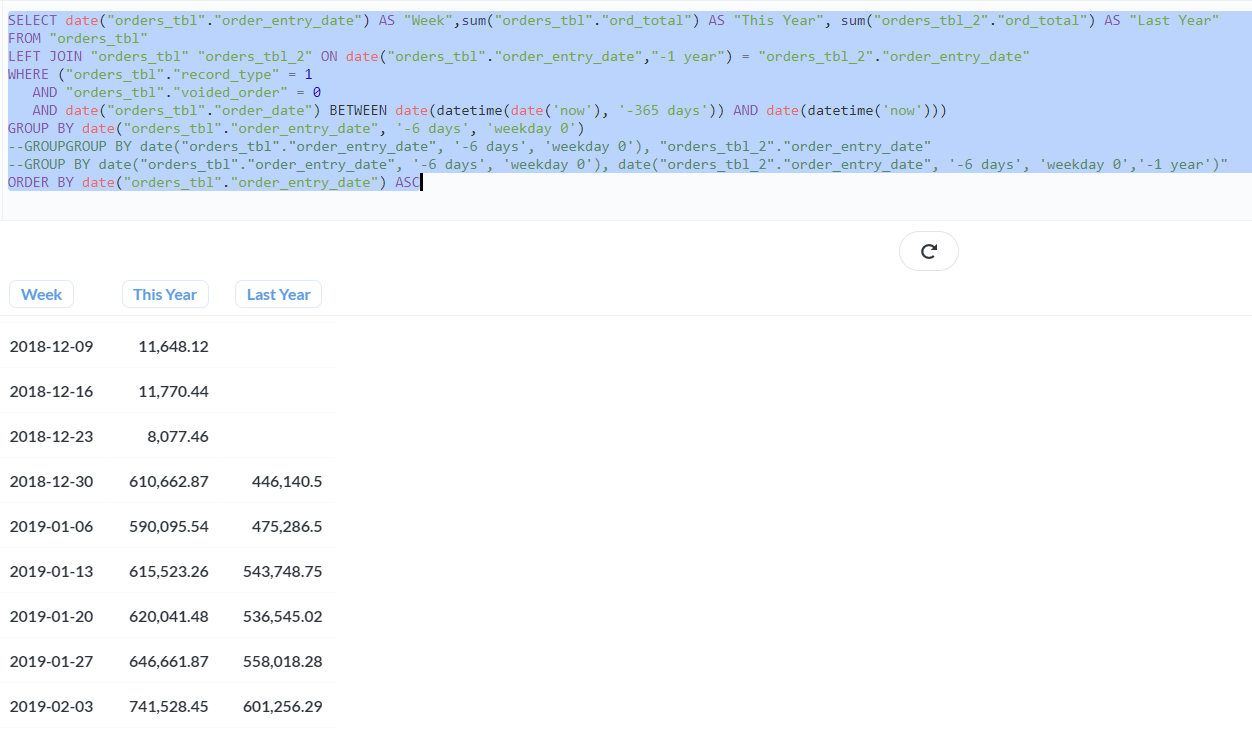
I played around with this for a while and came up with something close. the below gives correct values in cases where there is no last year data, i.e. only column one exists. but when matches exist between this year and last year, i get this exploded value as you can see in the screen capture.
Regarding the year over year comparison, i ran across the UNION ALL command and tried that. But i think the usage is slightly different than my needs, maybe not here is what I constructed using UNION all. I can get correct numbers in current year, OR, prior year, but cant seem to get both.
SELECT date(“orders_tbl”.“order_entry_date”) AS “Week”,sum(“orders_tbl”.“ord_total”) AS “This Year”,sum(“orders_tbl”.“ord_total”) AS “Last Year”
FROM “orders_tbl”
WHERE (“orders_tbl”.“record_type” = 1 AND “orders_tbl”.“voided_order” = 0 AND date(“orders_tbl”.“order_entry_date”) BETWEEN date(datetime(date(‘now’), ‘-1 Year’)) AND date(datetime(‘now’)))
GROUP BY date(“orders_tbl”.“order_entry_date”, ‘-6 days’, ‘weekday 0’)
UNION ALL
SELECT date(“orders_tbl”.“order_entry_date”,"+1 Year") AS “Week”,sum(“orders_tbl”.“ord_total”) AS “This Year”,sum(“orders_tbl”.“ord_total”) AS “Last Year”
FROM “orders_tbl”
WHERE (“orders_tbl”.“record_type” = 1 AND “orders_tbl”.“voided_order” = 0 AND date(“orders_tbl”.“order_entry_date”) BETWEEN date(datetime(date(‘now’), ‘-2 Years’)) AND date(datetime(‘now’), ‘-1 Year’))
GROUP BY date(“orders_tbl”.“order_entry_date”, ‘-6 days’, ‘weekday 0’)
ORDER BY date(“orders_tbl”.“order_entry_date”) ASC
I figured this one out, code is below. The solution is to create two table variables referencing the original table, the difference between them lies in the WHERE clause where table1 is the year range and table2 is pvs year range. both are joined with date of 12 month offset. produces the three columns nicely.
SELECT *
FROM
(SELECT date(“orders_tbl”.“order_entry_date”,’-6 days’, ‘weekday 0’) AS “Week”,sum(“orders_tbl”.“ord_total”) AS “This Year”
FROM “orders_tbl”
WHERE (“orders_tbl”.“record_type” = 1 AND “orders_tbl”.“voided_order” = 0 AND date(“orders_tbl”.“order_entry_date”) BETWEEN date(‘now’,’-1 Year’,‘localtime’) AND date(‘now’,‘localtime’))
GROUP BY date(“orders_tbl”.“order_entry_date”, ‘-6 days’, ‘weekday 0’)
ORDER BY date(“orders_tbl”.“order_entry_date”) ASC) AS table_1
LEFT JOIN
( SELECT date(“orders_tbl”.“order_entry_date”,’-6 days’, ‘weekday 0’) AS “LY_week”,sum(“orders_tbl”.“ord_total”) AS “Last Year”
FROM “orders_tbl”
WHERE (“orders_tbl”.“record_type” = 1 AND “orders_tbl”.“voided_order” = 0 AND date(“orders_tbl”.“order_entry_date”) BETWEEN date(‘now’, ‘-2 years’,‘localatime’) AND date(‘now’, ‘-1 years’,‘localtime’))
GROUP BY date(“orders_tbl”.“order_entry_date”, ‘-6 days’, ‘weekday 0’)
) AS table_2 ON date(table_1.Week) = date(table_2.LY_week,‘1 year’)