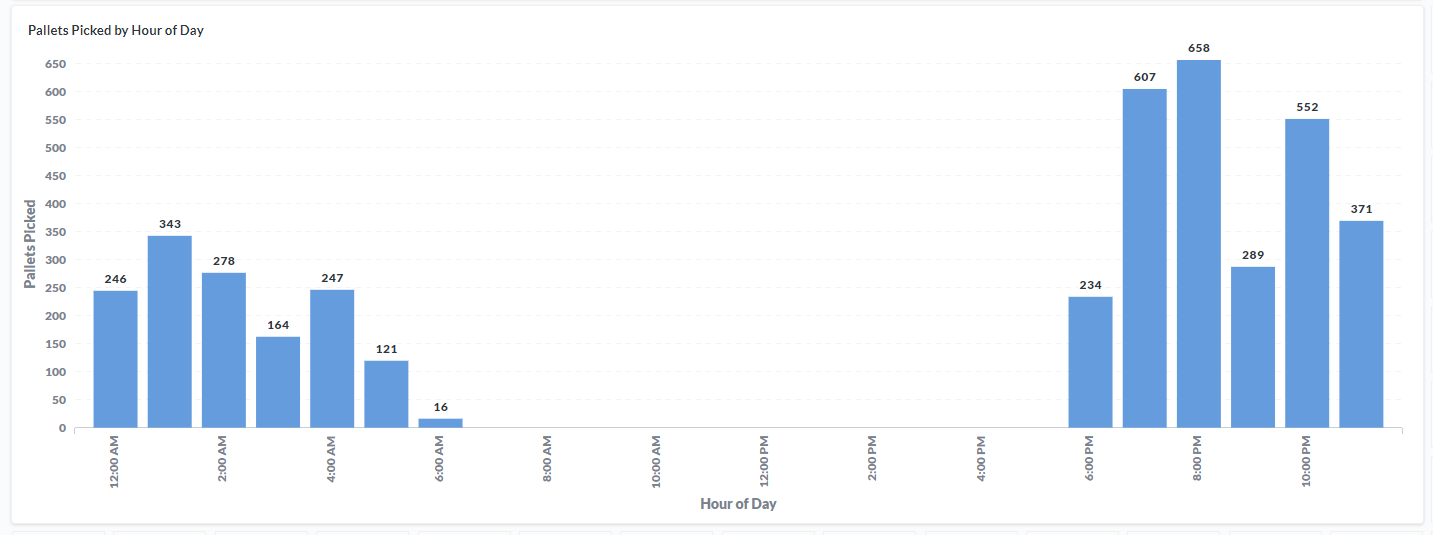
I'm having trouble getting the x-axis to display the axis value label for all hours of the day. Any idea what I
I'm doing wrong? I tried various axis settings.
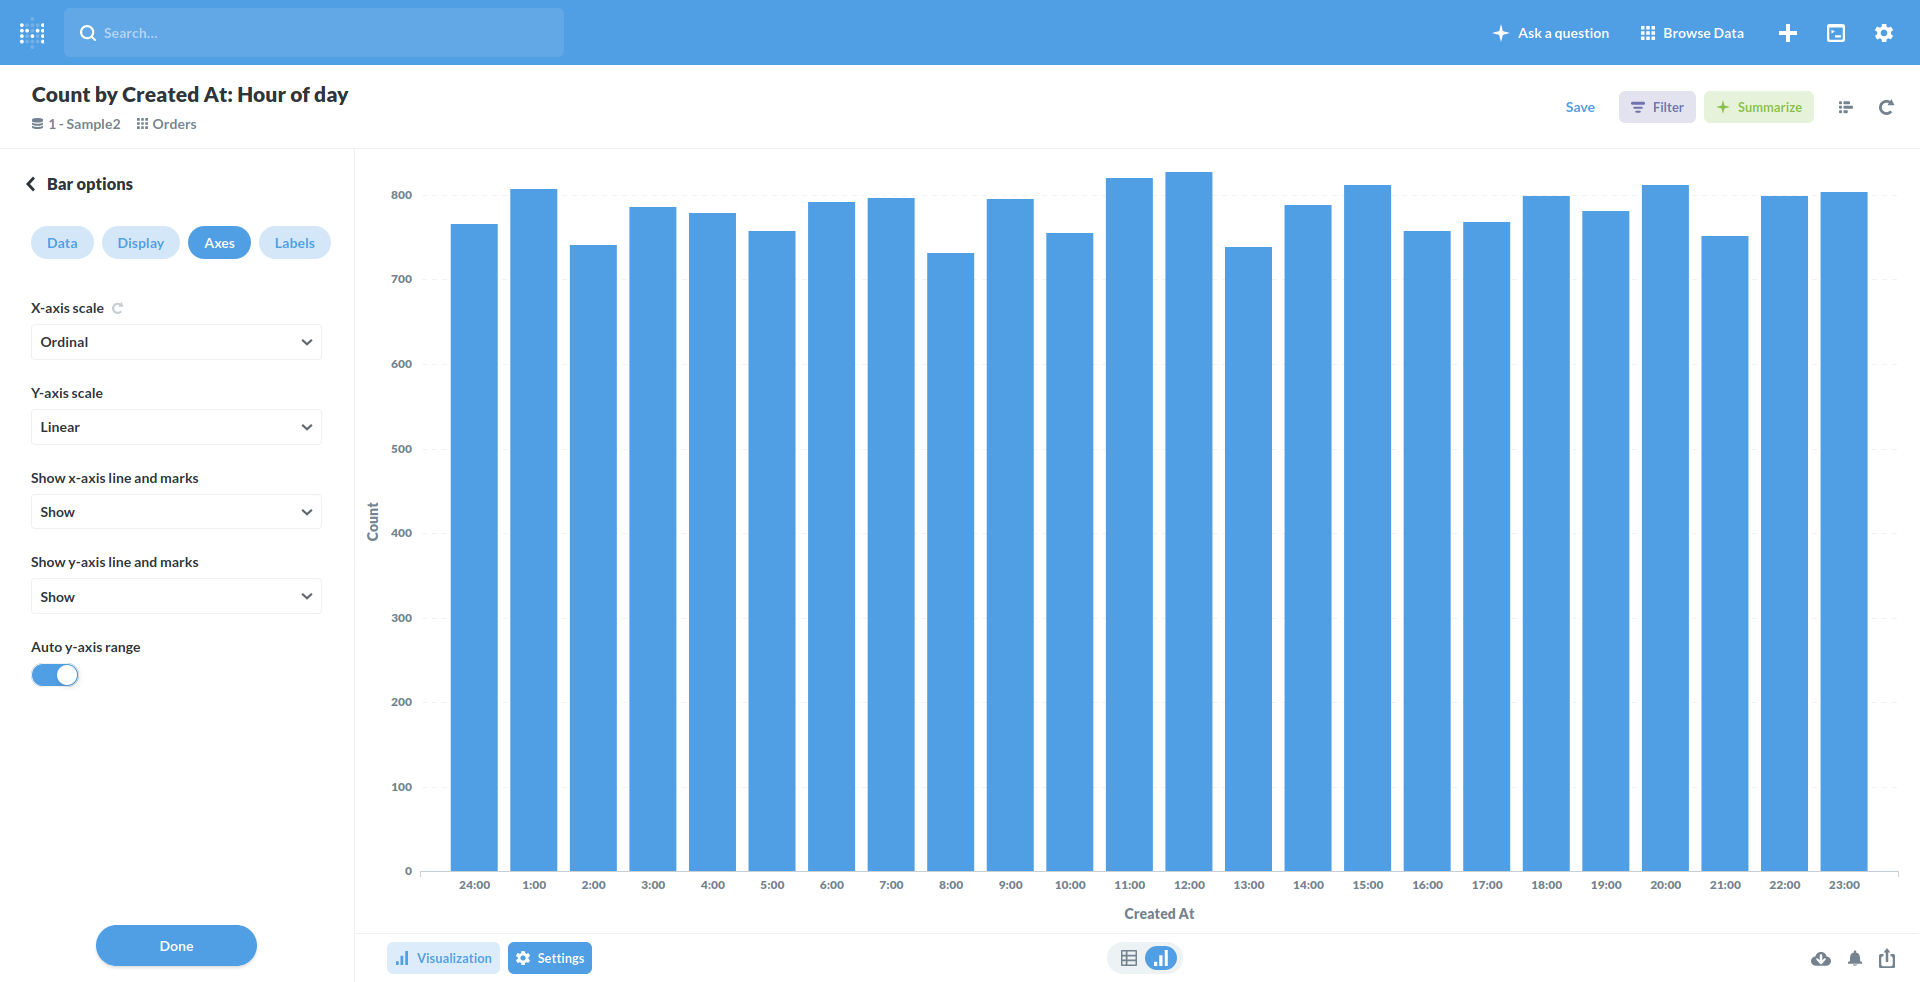
Hi @mateofstate
If you set "X-axis scale" to "Ordinal", then it will always show all ticks.
There's an issue about how ticks are handled:
Dashboard: Too Less Dates Displayed on Axis · Issue #12699 · metabase/metabase · GitHub - upvote by clicking ![]() on the first post
on the first post
Related:
"Show x-axis" setting doesn't have any effect on small dashboard questions · Issue #7058 · metabase/metabase · GitHub
Formatting: Date formatting w/o year to better fit smaller screens · Issue #12684 · metabase/metabase · GitHub