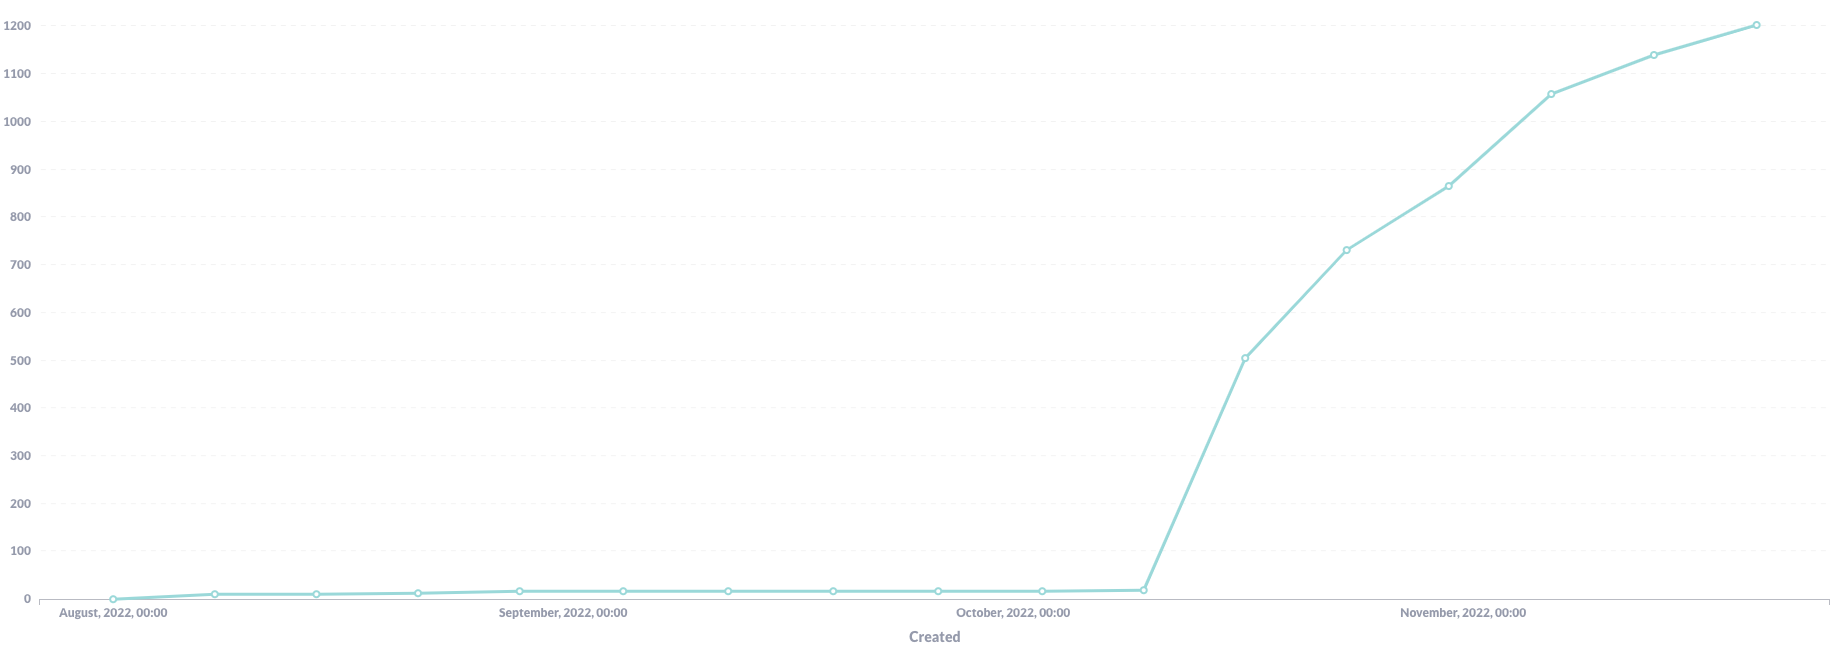
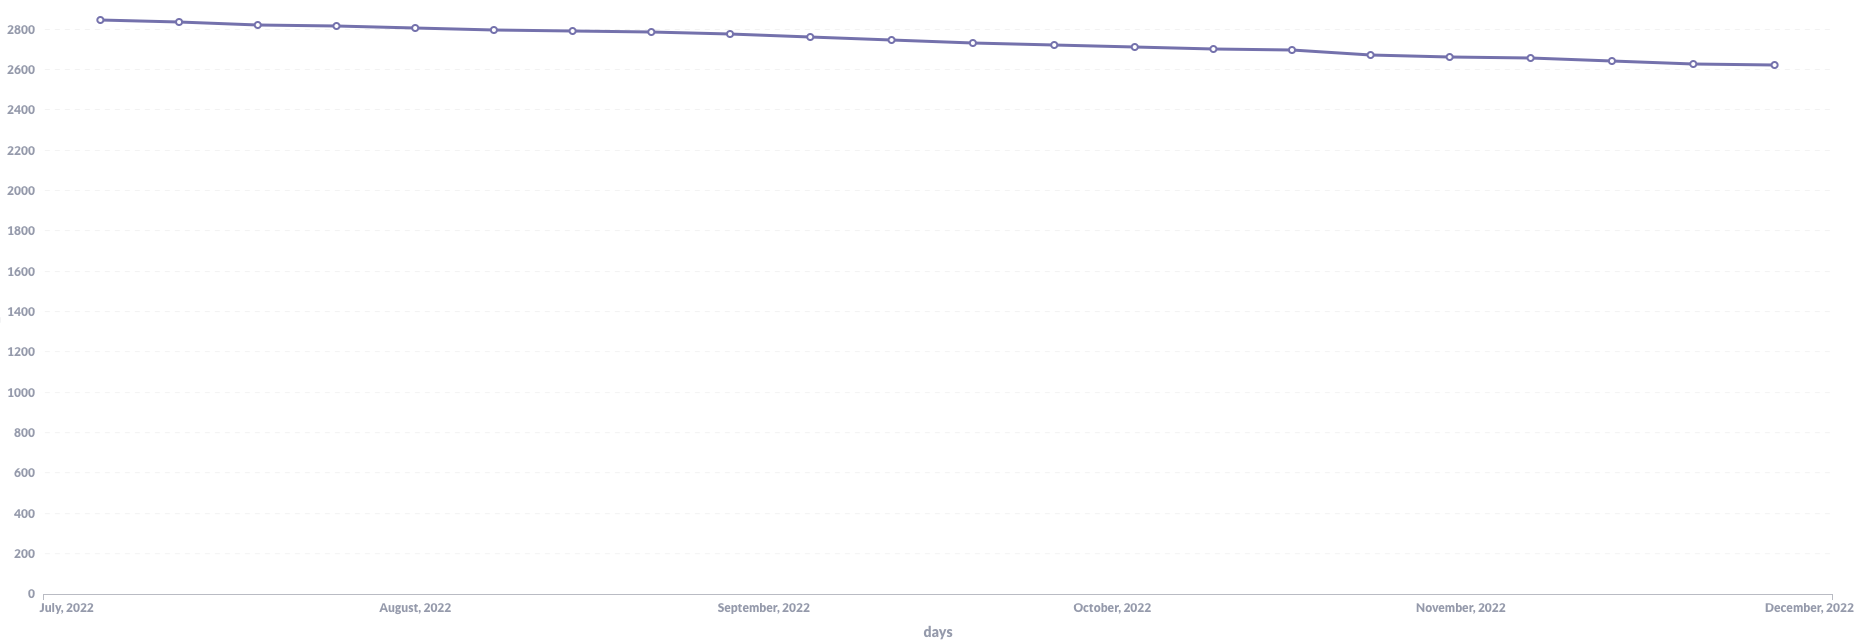
I have created a chart with multiple time series with these three time series:

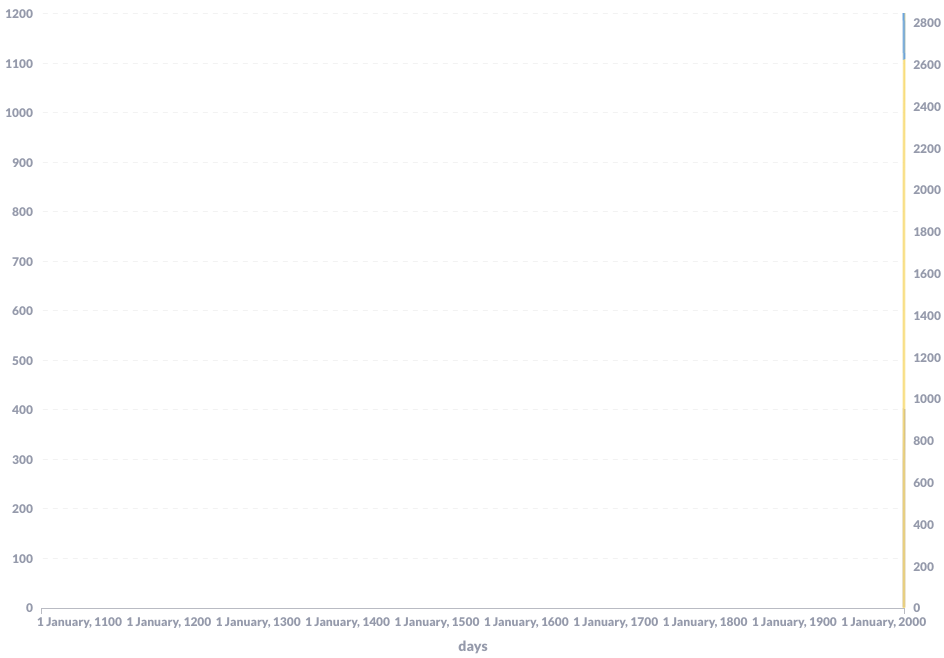
but when I combine them together in one chart the X-axes set the starting point of the time range way ahead the first point of the three series and this is the result:
I have created a chart with multiple time series with these three time series:
but when I combine them together in one chart the X-axes set the starting point of the time range way ahead the first point of the three series and this is the result:
Hi @Loris.Elba
Post "Diagnostic Info" from Admin > Troubleshooting.
Looking at your screenshots, it seems like there might be difference in the column types, which makes it very difficult for Metabase to combine the series. The series has to produce the same X-axis type.