For the days 1 to 3 october, the X axis plot the labels with issue. For the table the values is corrects, for de graphiz, the day 2 october be repited tow many sames.**
Hi @Chrissroman
Post "Diagnostic Info" from Admin > Troubleshooting.
A screenshot is worth a million words, since it's difficult to understand what you mean by "be repited tow many sames".
1 Like
Sorry, I wasn't write correctly.
Here a pictures with an example.
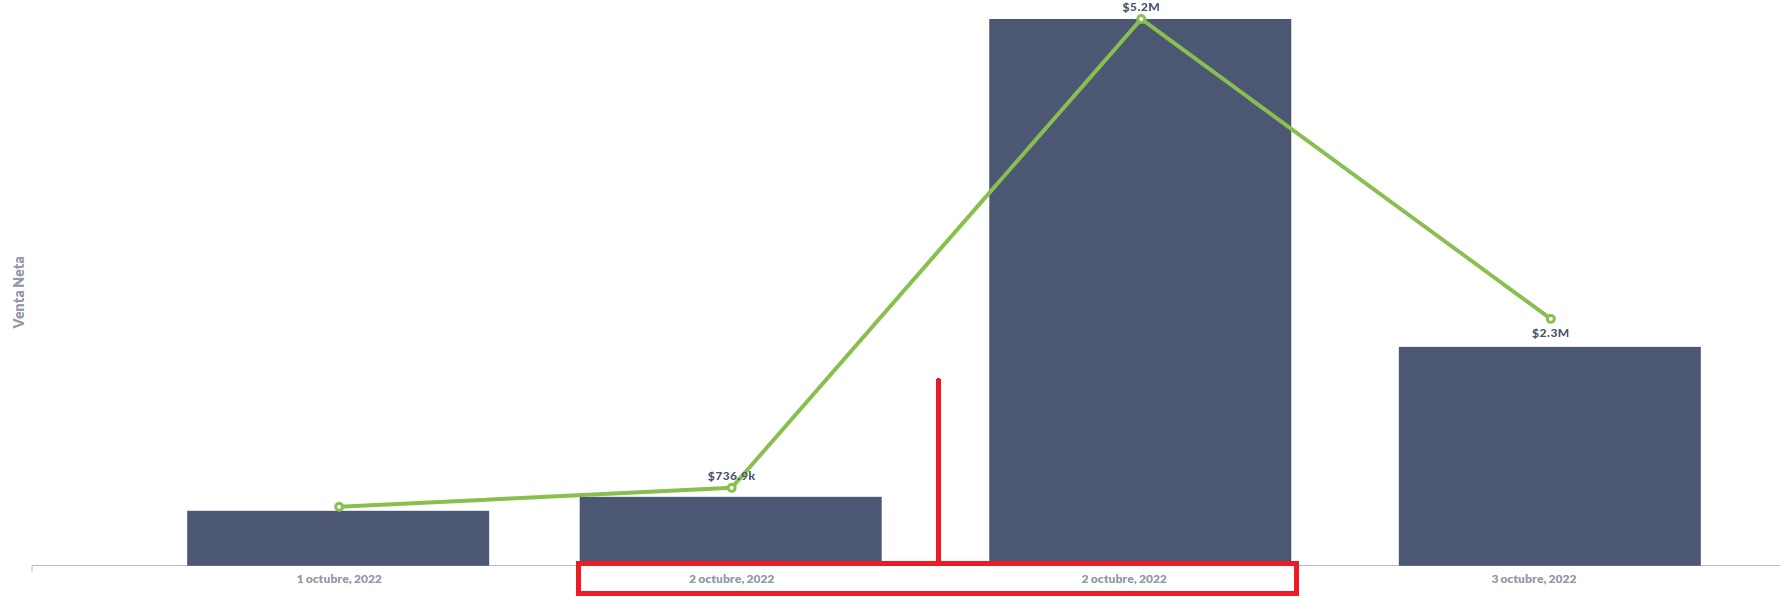
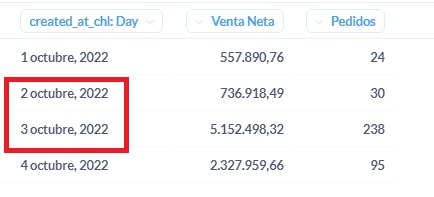
For a side, the data is grouped correctly (table), for the other side, when I graphic in the X Axis, the date of 2 october is repeated 2 times.