Hi ,
I am using latest version 33.7.3 of metabase with postgres as application database.
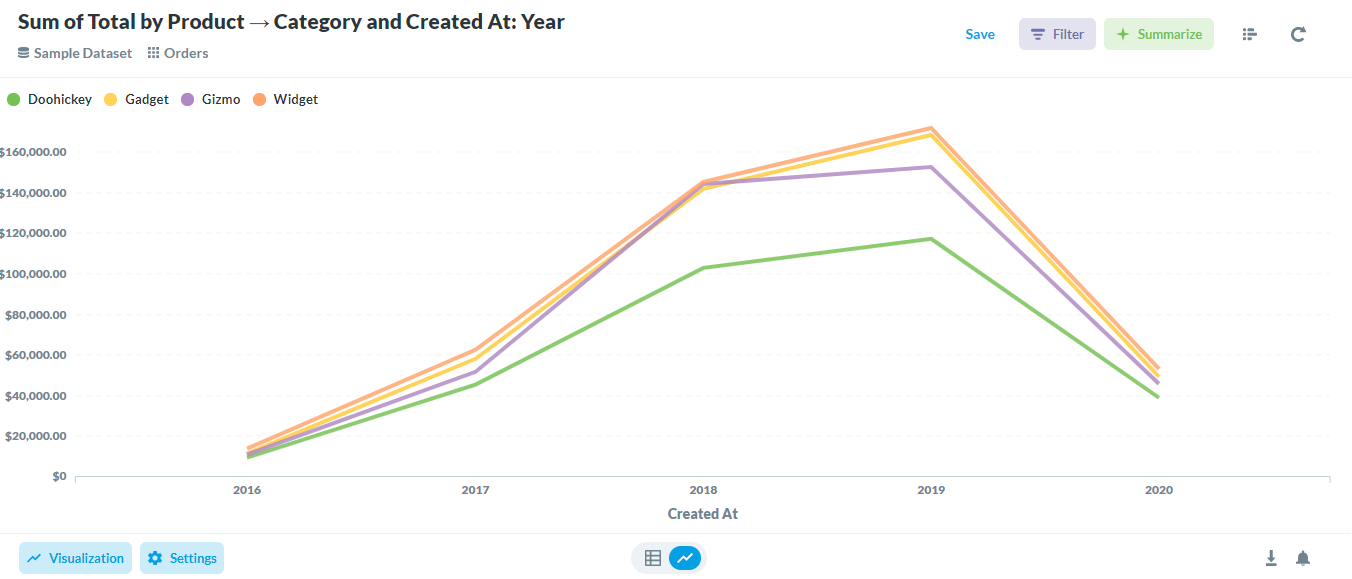
I created a simple query with following details from sample data set.
visualisation = Line Chart
X Axis - Created-at (Year level) and then by Category field from products table
Y Axis - Sum of Total from Orders table.
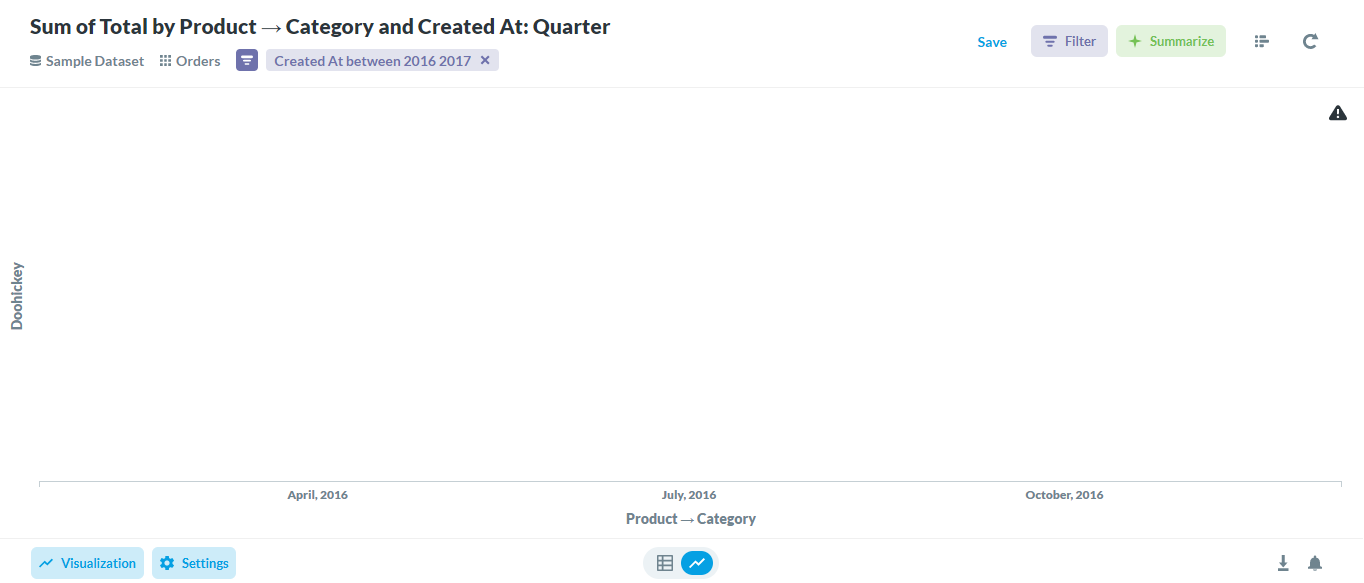
This combination works very well and gets data correctly , now when i select a region and drag the area it drill through to detail where the tabular data is fine, however the chart is not showing data and it has x axis as months (from createdat field) which is fine and y axis is taking first value of the category which may be causing issue and not showing graph correctly.
Please see attached graphs
 on the first post