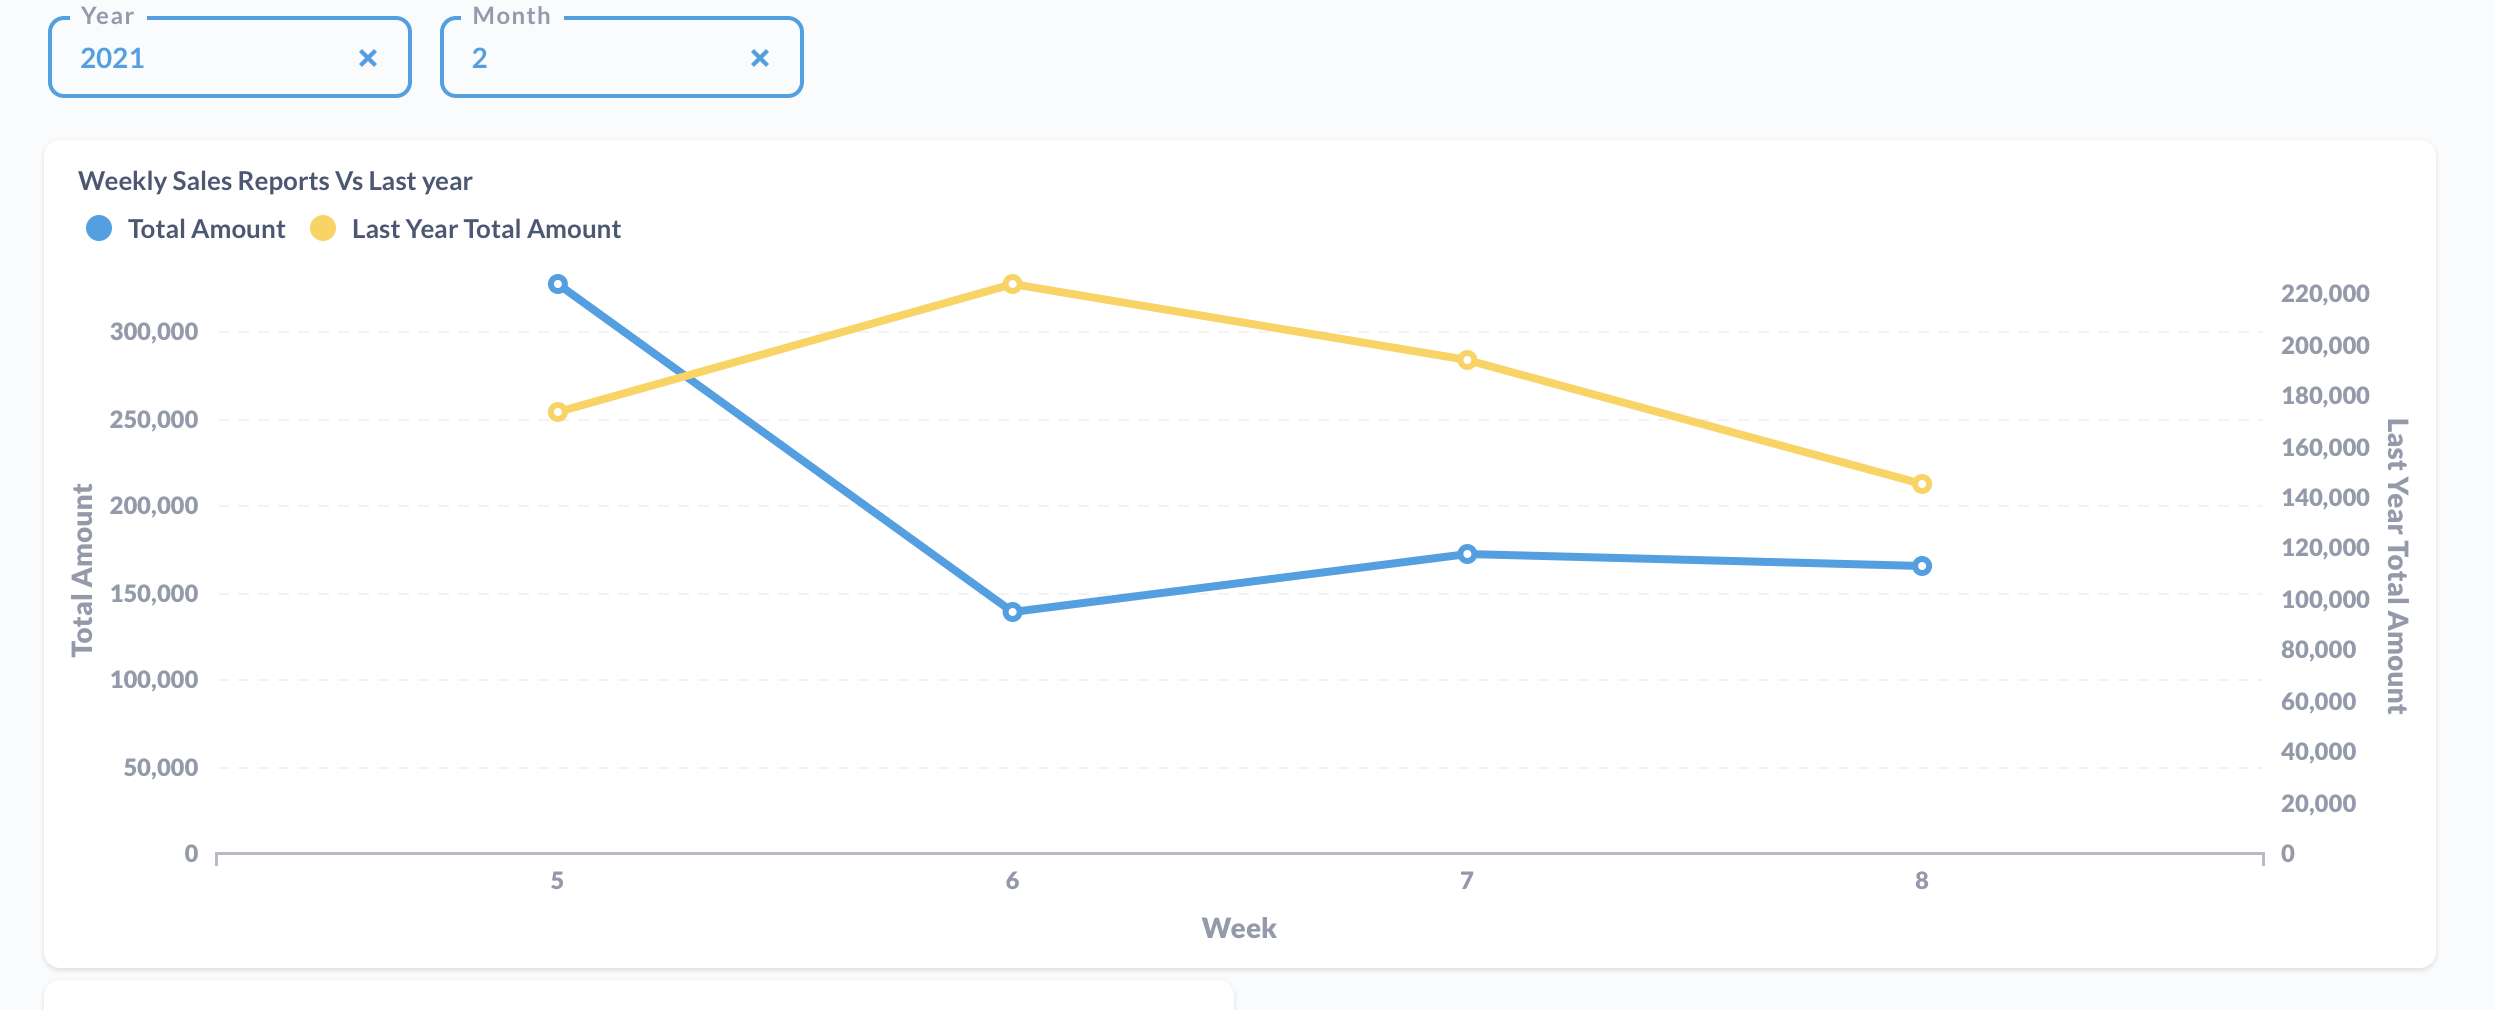
Hi, we have the following dashboard and when we click it takes us to a question, but I'd like the filter to be by the week (6 shown in X axis). Instead it's by the sum(week) as shown in the tooltip (30) which doesn't make much sense. Is there any way to do this?

Yes I have, it uses the value 30 to filter instead of 6, that's my issue. That's because there's 5 rows of data on week 6 and it does a sum of the week value. Since week is the X axis I think this behavior is wrong.
That's a multi-series chart right? you need to try to expose the number 6 to the chart or otherwise Metabase won't be able to pass the parameter
It's not actually a multi series chart, it's made from two different columns in the same dataset. I realised that the behavior is different if I convert it into the string and it does what I want, but it messes up the order of the numbers.
@biellls Post "Diagnostic Info" from Admin > Troubleshooting.
And try going into the question - I'm fairly sure there's a triangle-warning in the upper-right corner, which warns about unaggregated data.
Why are you returning 5 rows of data for each point instead of aggregating it (summing, grouping), which is what you want (from what I can understand from your screenshots)?