Hello,
I am actually using metabase for an intership and I am kinda stuck with an issue, I want to merge 2 chart which are not histogram( can be a pie chart, a gauge chart or a pivot table).
I would like to know if someone know, if it's possible or if we can do it.
I want to have this pivot table merge with my other tables (which have the same columns).
I tried to join tables but it adds the value of all table in one pivot whereas it should look like this:
Hope someone can help me, and thank you in advance
Hi @caffrop
You'll have to merge at the data level. Example in SQL with UNION ALL
If you want to have separate Pivot Tables, then just create different questions and add those to a dashboard.
So if I am using sparkSQL, I have to merge my tables with saprk ? (I have an other question but on an other theme should I create a topic or I can ask here?)
@caffrop I don't know exactly what you are trying to do, but it sounds like ETL, which should be done elsewhere than in Metabase.
Create a new topic if it is completely different from this.
Sorry I don't express myself properly my english is a bit rusty. So I have a databse and in this database I have 6 tables, which all have have some identic columns.
I want to do a synthesis pivot table so I can compare my data from these tables.
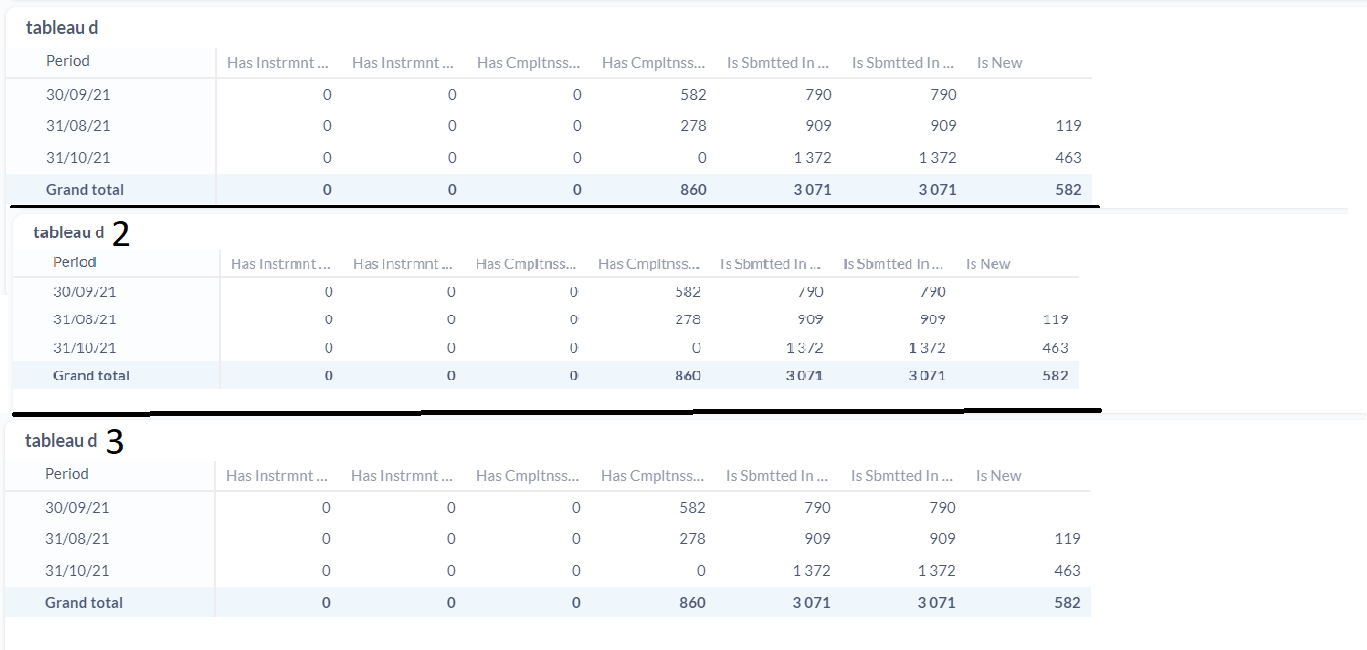
Like this image, each table is "tableau d 1", "tableau d 2"...
Do you know if it is possible to do it in one chart ?
@caffrop
- You would have to create 6 different question and add those to a dashboard.
- Or combine your data, example:
select * from table1
union all
select * from table2
union all
...