Hi,
When using an alias on fields the graph looks wrong.
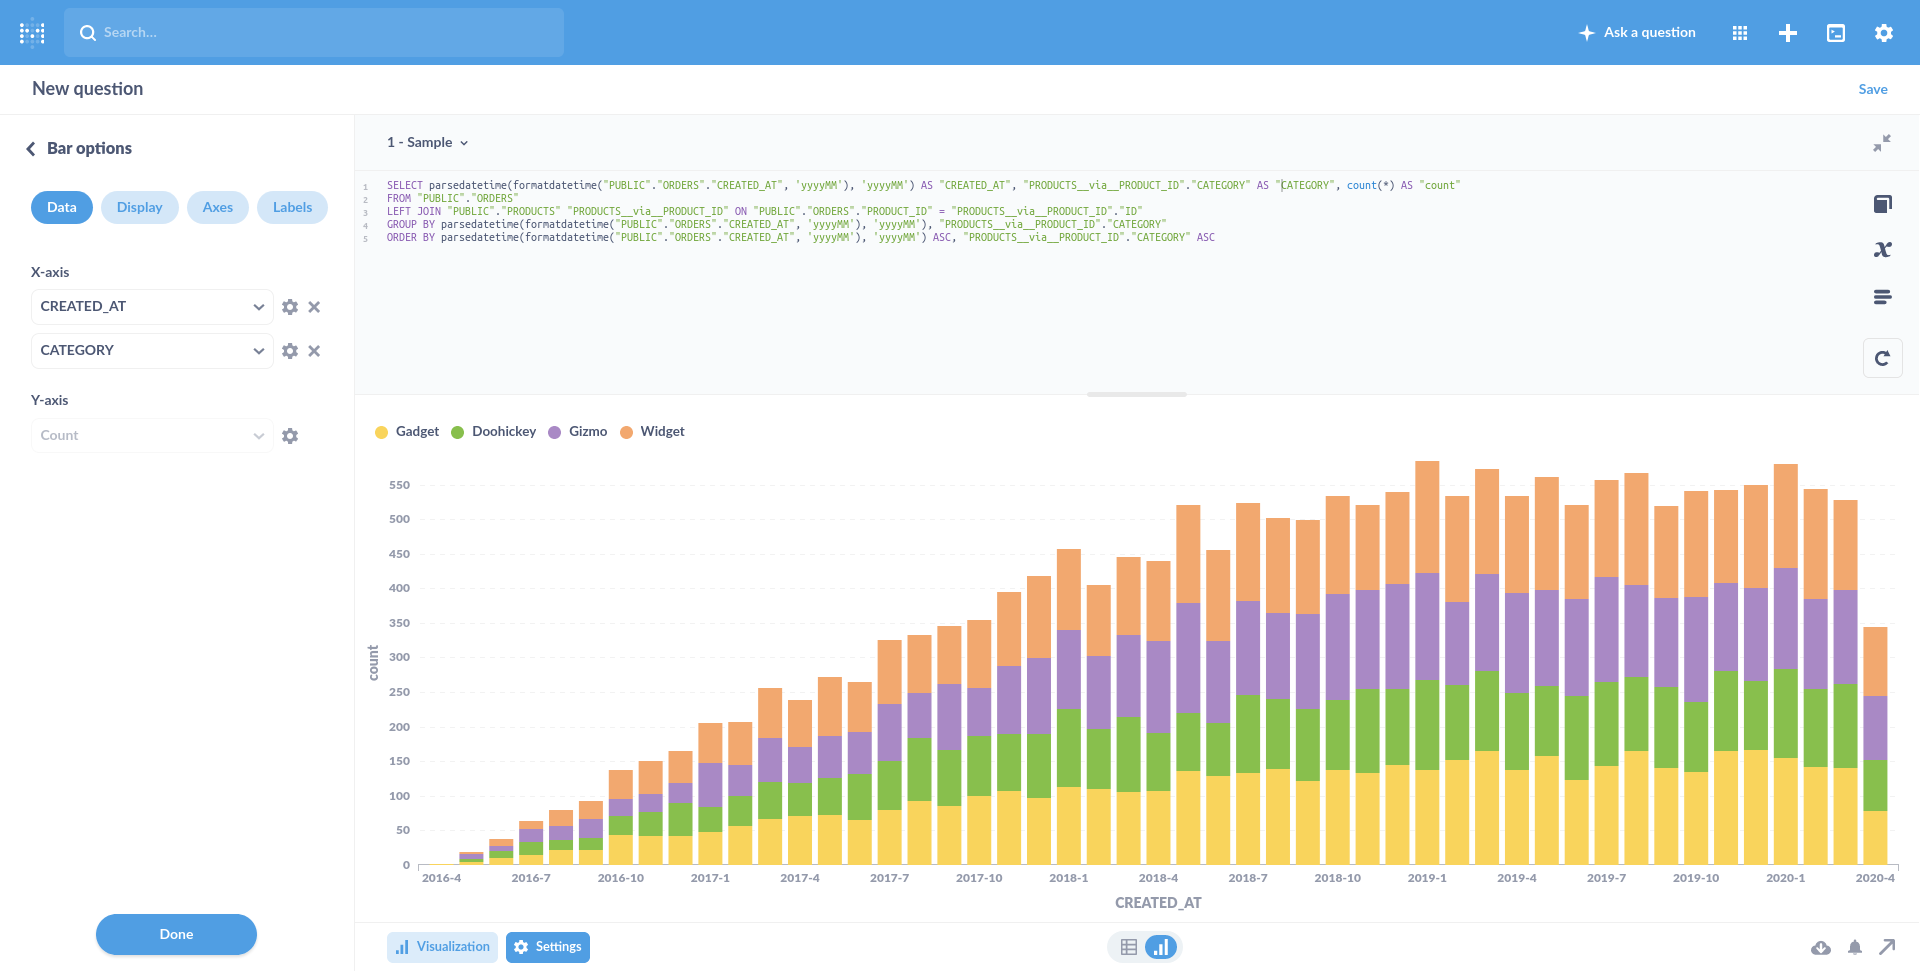
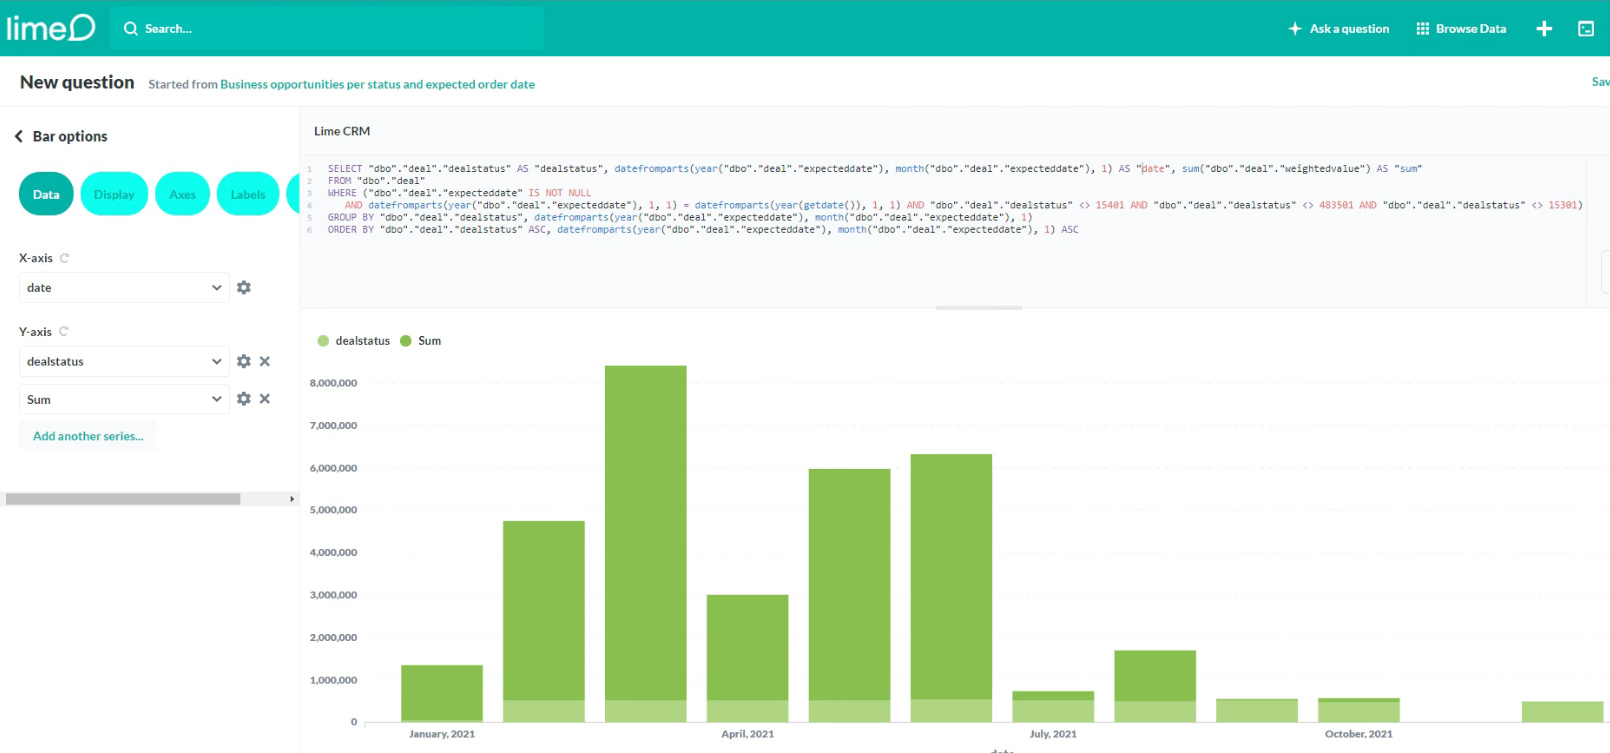
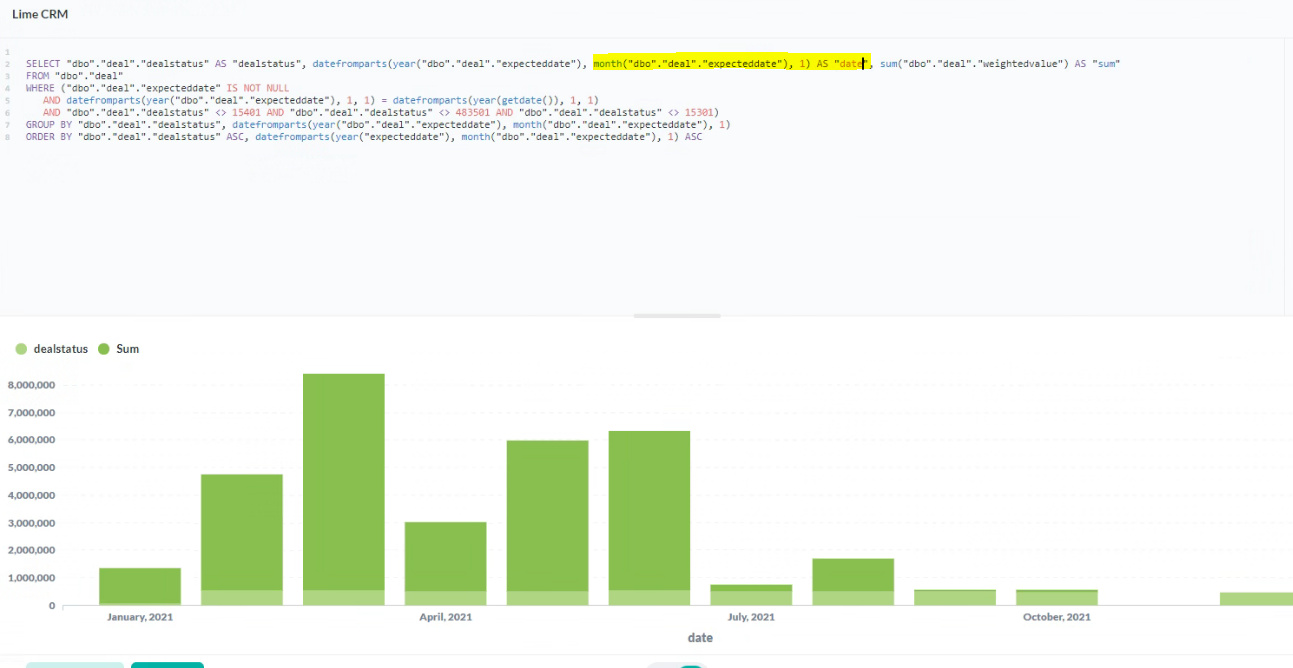
This is correct
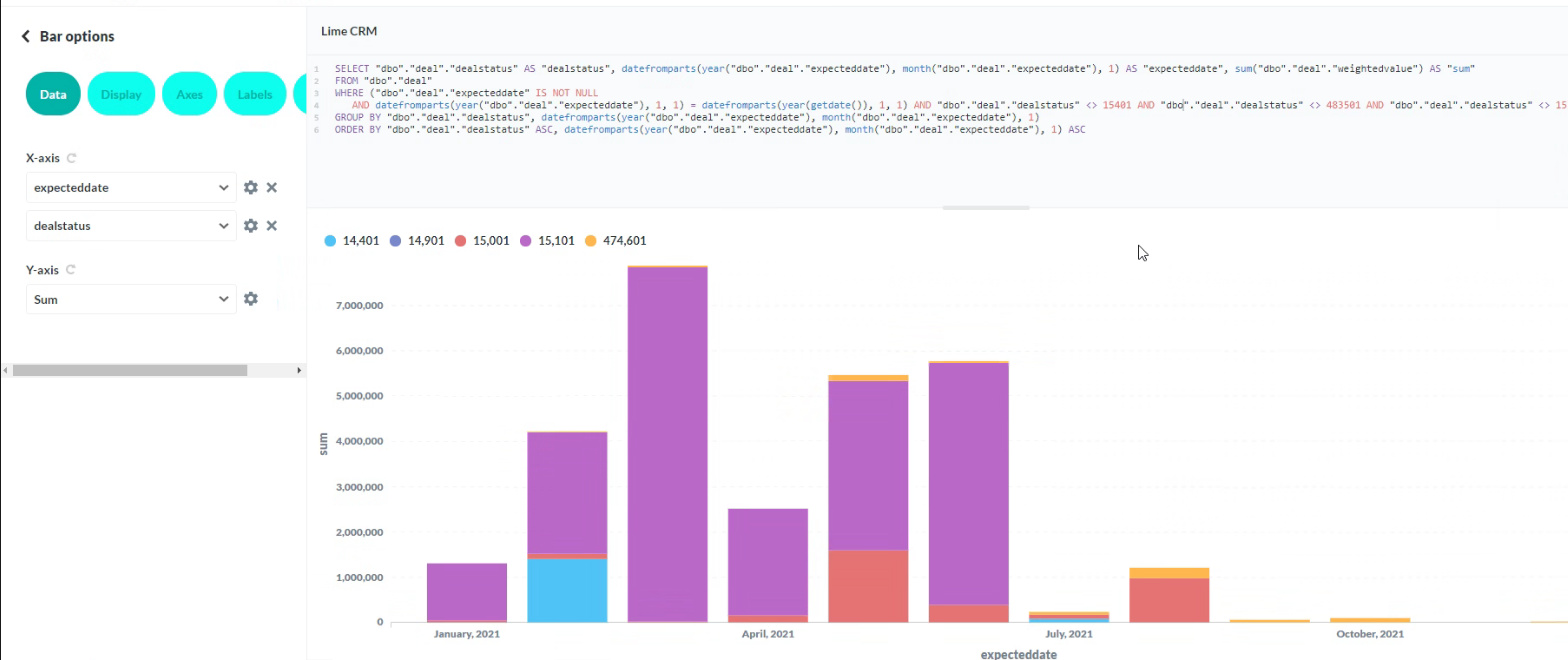
And this happens when I change the alias to "date":
I have to use alias because this query is a part of a UNION ALL.
Hi,
When using an alias on fields the graph looks wrong.
This is correct
I have to use alias because this query is a part of a UNION ALL.
Hi @aminademirovic
So what is wrong? You are not showing the visualization Settings, which I'm guessing it's choosing different fields on the axes, when you change the name.
As you see the group by does not work for me at all as soon as I change the alias to something else..
I want to group by me date but have to have an alias because the field names differ in my two queries.
Cant see anything in the settings that helps me.
If you change you alias from "created_at" to "date" does the graph still look the same?
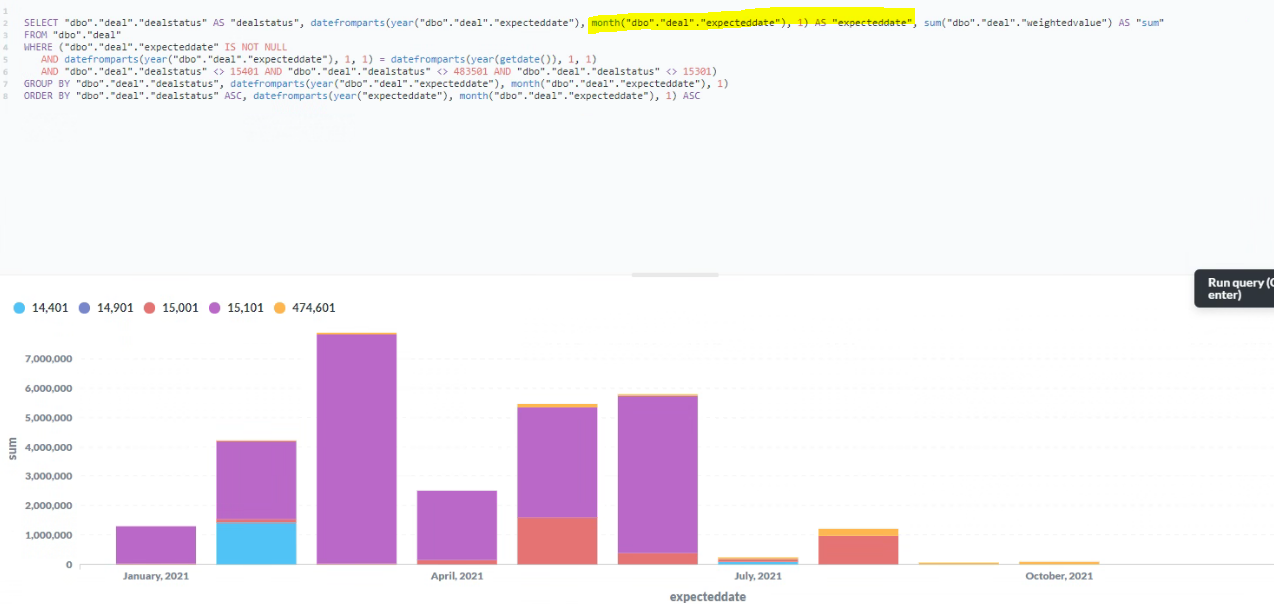
here is my full query:
select date, sum(sum1) as "sum" from (
SELECT "dbo"."deal"."dealstatus" AS "dealstatus", datefromparts(year("dbo"."deal"."expecteddate"), month("dbo"."deal"."expecteddate"), 1) AS "expecteddatee", sum("dbo"."deal"."weightedvalue") AS "sum"
FROM "dbo"."deal"
WHERE ("dbo"."deal"."expecteddate" IS NOT NULL
AND datefromparts(year("dbo"."deal"."expecteddate"), 1, 1) = datefromparts(year(getdate()), 1, 1)
AND "dbo"."deal"."dealstatus" <> 15401 AND "dbo"."deal"."dealstatus" <> 483501 AND "dbo"."deal"."dealstatus" <> 15301)
GROUP BY "dbo"."deal"."dealstatus", datefromparts(year("dbo"."deal"."expecteddate"), month("dbo"."deal"."expecteddate"), 1)
UNION ALL
SELECT "dbo"."deal"."dealstatus" AS "dealstatus", datefromparts(year("dbo"."deal"."expecteddate"), month("dbo"."deal"."expecteddate"), 1) AS "expecteddate", sum("dbo"."deal"."weightedvalue") AS "sum"
FROM "dbo"."deal"
WHERE ("dbo"."deal"."closeddate" IS NOT NULL
AND datefromparts(year("dbo"."deal"."closeddate"), 1, 1) = datefromparts(year(getdate()), 1, 1)
AND "dbo"."deal"."dealstatus" <> 15401 AND "dbo"."deal"."dealstatus" <> 483501 AND "dbo"."deal"."dealstatus" <> 15301)
GROUP BY "dbo"."deal"."dealstatus", datefromparts ) x group by date and "dbo"."deal"."dealstatus"
ORDER BY "dbo"."deal"."dealstatus" ASC, datefromparts(year("dbo"."deal"."date"), month("dbo"."deal"."date"), 1) ASC
{
"browser-info": {
"language": "sv",
"platform": "Win32",
"userAgent": "Mozilla/5.0 (Windows NT 10.0; Win64; x64) AppleWebKit/537.36 (KHTML, like Gecko) Chrome/91.0.4472.124 Safari/537.36",
"vendor": "Google Inc."
},
"system-info": {
"java.runtime.name": "Java(TM) SE Runtime Environment",
"java.runtime.version": "1.8.0_111-b14",
"java.vendor": "Oracle Corporation",
"java.vendor.url": "http://java.oracle.com/",
"java.version": "1.8.0_111",
"java.vm.name": "Java HotSpot(TM) 64-Bit Server VM",
"java.vm.version": "25.111-b14",
"os.name": "Windows NT (unknown)",
"os.version": "10.0",
"user.language": "en",
"user.timezone": "Europe/Berlin"
},
"metabase-info": {
"databases": [
"sqlserver"
],
"hosting-env": "unknown",
"application-database": "postgres",
"application-database-details": {
"database": {
"name": "PostgreSQL",
"version": "13.1"
},
"jdbc-driver": {
"name": "PostgreSQL JDBC Driver",
"version": "42.2.8"
}
},
"run-mode": "prod",
"version": {
"tag": "v1.34.3",
"date": "2020-02-28",
"branch": "enterprise-release-1.34.x",
"hash": "ab6cc46"
},
"settings": {
"report-timezone": null
}
}
}
incorrect graph:
Correct graph:
The only thing that differs the incorrect and correct is the alias
@aminademirovic Okay, I don't understand the problem, but you can change the axes in Settings sidebar.
You are using an old version of Metabase (and Java), and it's an Enterprise Edition, so I would recommend that you contact support via email.
The presentation of the graph looks wrong. If you look at the second staple the incorrect staple should look more like the correct graph - at least 3 diffrent colors and values.
Create a whole new question, save with another name and show it, it seems to me that there is a problem here to "old" memorized chart settings and visualization. 
@aminademirovic Metabase cannot always guess which axis you want to use a column on - it tries, but it's not always correct. So when it guesses wrong, then you can change the axes in the settings.