@crwheelr
Click the “Switch to SQL” button on 0.32 just above the query browser. It’s called “View the SQL” on 0.33 and is inside the Editor (aka Notebook) panel.
All the documentation makes several references to the Admin section and how to get there. It’s very few people who normally access the Admin section and on a regular basis, which is why it does not have it’s own primary button.
sorry for my general ineptness but i am not seeing View the SQL" anywhere within the editor page
chuck
@crwheelr
On 0.33.0-RC1 it was located to the left of the Editor-toggle, but in the final release it will be located on the right:
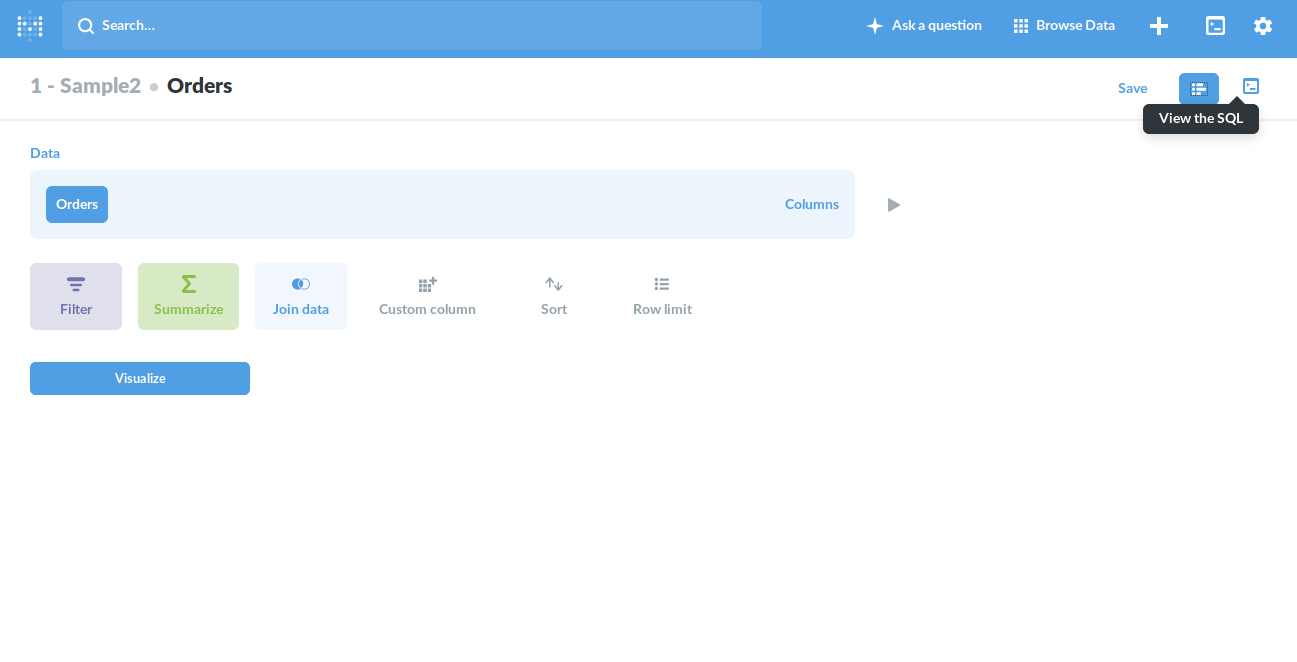
ARGH, okay i found the icon.
never done this. view the SQL, convert, i can edit it then, and save.
i take it that this metric is now based on my edits
chuck
@crwheelr
Great.
I don’t understand what you mean with “this metric is now based on my edits”?
It’s a query, just like when you do a Custom Question - the only different is that the Custom Question makes a simple user interface, so you don’t have to code anything.
With the Native query (SQL), you would make the changes in the query instead of a nice interface.
@flamber - you can disengage whenever you wish on the topic as i see i am being somewhat pesky on this.
if I visualize this bar chart question, the total value displays with offset time, that is the consequence of sqlite not supporting timezones. my effort then, is to insert the sqlite argument “localtime” into the datetime functions. however the simple act of converting the above question to SQL (with no edits on my part as of yet), produces the sum value with x-axis test as “2000” (not 8/14/18 3AM as was evident before the SQL conversion took place.
this below is how i would have implimented the localtime addition, but as x axis is giving me 2000 i cannot evaluate if the below is working correctly
Charles
SELECT datetime(strftime(’%Y-%m-%d %H:00’, “orders_tbl”.“order_date”)) AS “order_date”, sum(“orders_tbl”.“ord_total”) AS “sum”
FROM “orders_tbl”
WHERE (“orders_tbl”.“record_type” = 1
AND “orders_tbl”.“voided_order” = 0 AND date(“orders_tbl”.“order_date”) = date(datetime(‘now’)))
GROUP BY datetime(strftime(’%Y-%m-%d %H:00’, “orders_tbl”.“order_date”),“localtime”)
ORDER BY datetime(strftime(’%Y-%m-%d %H:00’, “orders_tbl”.“order_date”),“localtime”) ASC
@crwheelr
I don’t have access to your data, so it’s quite difficult to test, but you need to convert the column timezone before doing anything else. Maybe the query should looks something like this if your SQLite is stored in UTC, but you want to get localtime:
SELECT
  strftime('%Y-%m-%d %H:00', datetime("orders_tbl"."order_date", "localtime")) AS "order_date",
  sum("orders_tbl"."ord_total") AS "sum"
FROM "orders_tbl"
WHERE (1=1
  AND "orders_tbl"."record_type" = 1
  AND "orders_tbl"."voided_order" = 0
  AND date(datetime("orders_tbl"."order_date", "localtime")) = date(datetime('now', "localtime"))
)
GROUP BY strftime('%Y-%m-%d %H:00', datetime("orders_tbl"."order_date", "localtime"))
ORDER BY strftime('%Y-%m-%d %H:00', datetime("orders_tbl"."order_date", "localtime")) ASC
the most amazing result occurred. i find now that simply converting to SQL query, the time offset issue is solved. i cannot explain why. no “localtime” parameter used. Java started with no Duser.timezone attribute and MB admin timezone setting as PST. very strange but repeatable as i have tried it with several charts now. convert to sql and it works.
charles
the x axis of time of day is listed as “January 1, 2000,11:00 AM” for example.
would there be a way to surpress so axis only displays time? i.e.11:00 AM
SELECT datetime(strftime(’%Y-%m-%d %H:00’, “orders_tbl”.“order_entry_time”)) AS “order_entry_time”, sum(“orders_tbl”.“ord_total”/30) AS “sum”
FROM “orders_tbl”
WHERE (“orders_tbl”.“record_type” = 1
AND “orders_tbl”.“voided_order” = 0 AND date(“orders_tbl”.“order_date”) BETWEEN date(datetime(date(‘now’), ‘-30 days’)) AND date(datetime(‘now’)))
GROUP BY datetime(strftime(’%Y-%m-%d %H:00’, “orders_tbl”.“order_entry_time”))
ORDER BY datetime(strftime(’%Y-%m-%d %H:00’, “orders_tbl”.“order_entry_time”)) ASC
@crwheelr
You cannot just use time, when you’re viewing multiple days, but if you just want to see the average of sales of a specific hour, then change %Y-%m-%d %H:00 to %H:00 all three places.
@flamber
ok got that. regarding the timezones, as stated earlier values were computing correctly but after 4PM (again) values go to zero. I’ve learned that the sqlite database is seeing the datetime(‘now’) in UTC, and the date advances at 4PM. so i tried modifying datetime (‘now’,‘localtime’) and got the same result
externally with an sql tool i ran the query select datetime(‘now’) and found exactly same result as select datetime9’now’,‘localtime’) hmm. seems localtime isnt working. checking on sqlite on the web dont seem to be any gotchas here. but the localtime modifier is not doing it. pretty sure my final solution lies within this.
chuck
@crwheelr
Do you see a difference with this? Manually written, so haven’t checked for errors.
SELECT current_date, date(current_date, 'localtime'), current_time, time(current_time, 'localtime'), datetime('now'), datetime('now', 'utc'), datetime('now', 'localtime')
Maybe you should just use date() function if you’re only matching dates.
EDIT: And please please use ``` on the line before and after code - and use single ` around words to make it look like code, which will also preserve the exact formatting.
@flamber,
current time is 8:10:39
current date is 2019-08-15
2019-08-15 2019-08-15 15:10:39 15:10:39 2019-08-15 15:10:39 2019-08-15 15:10:39 2019-08-15 15:10:39
if i run this after 4PM the date will advance. that’s why my hourly pulse reports have zero tally after 4PM… localtime doesn’t work for me. localtime and UTC are identical tried it on two machines. I can just manually subtract the hours in the SQL queries
i.e. SELECT datetime(‘now’,’-7 hours’), but it commits my code for PST users only.
Chuck
@crwheelr
I don’t know.
Either continue to play around with Java timezone and Metabase reporting timezone, while trying various date formatting queries.
Or setup a proper database like Postgres and import the SQLite into that, and setup Metabase to get data from that.
I resolved the timezone issue with SQLite. as you know changing Java instance TZ and changing MB TZ did not give the desired result.
The solution was to convert my time sensitive questions to SOL, and modify the SQL including ‘localtime’ attribute in all time, date, datetime functions.
Thank you for support. As a down the road feature, you all might consider inclusion of ‘localtime’ attribute automatically for SQLite customers.
Charles.
@crwheelr
Great that you got it working.
I don’t think that can be added, since some people might already store their data as localtime instead of UTC in SQLite, so that would mess up their data.
I’m not sure what the best solution would be.
You’re welcome to open a feature request on Github.
The way i needed to mod the queries were as follows:
since dates and times are stored as text, they do in fact represent local time (I can see that), so when reading these in for MB time filtering, need to include the localtime attrib so that MB filters by my timezone’s time. also applies to dates as a date can change mid day if localtime not used.
Chuck
@flamber,
being aware that the forum is Metabase concentric, I am pressed into learning SQL basics to get more flexibility, which i am rather enjoying. Have come up with a complexity not sure how to approach though. Just asking if this is simple for you. Following is a query summing sales monthly for last 365 days. I want a second series “last_year” that will plot a second linechart, effectively giving me year-over-year comparison. I see where i can do the arithmetic (i.e. subtract 365 days on date function, but i am stymied how to get this second series with alternate timescale superimposed on the same chart.
do you have any thoughts on this? (i wont generally be bothering you with SQL stuff as i can figure most myself i think)
thanks
Charles
‘’’
SELECT date(“orders_tbl”.“order_date”, ‘start of month’) AS “order_date”, sum(“orders_tbl”.“ord_total”) AS “sum”
FROM “orders_tbl”
WHERE (“orders_tbl”.“record_type” = 1
AND “orders_tbl”.“voided_order” = 0 AND date(“orders_tbl”.“order_date”) BETWEEN date(datetime(date(‘now’), ‘-365 days’)) AND date(datetime(‘now’)))
GROUP BY date(“orders_tbl”.“order_date”, ‘start of month’)
ORDER BY date(“orders_tbl”.“order_date”, ‘start of month’) ASC
‘’’
@crwheelr
So with 0.33 you can do table joins, which means that you could create two similar SQL questions, where each question would have their own period (one covering -730 days to -365 days, and the other -364 days to today). Then you would group the questions by month-name/number and use that as the join between the two tables in your new question.
Otherwise you can do something similar in the current 0.32 version, but instead of creating a new question to join two existing questions, then you would combine the questions on a dashboard by clicking the Add button on the first chart.
If you search the forum, you’ll find many other people who have asked this question and various ways to solve it.
But this has nothing to do with hourly pulses anymore, so please create a new thread for new questions.