Hi,
I think this bug has been reported before.
The instance I could find reported it "fixed":
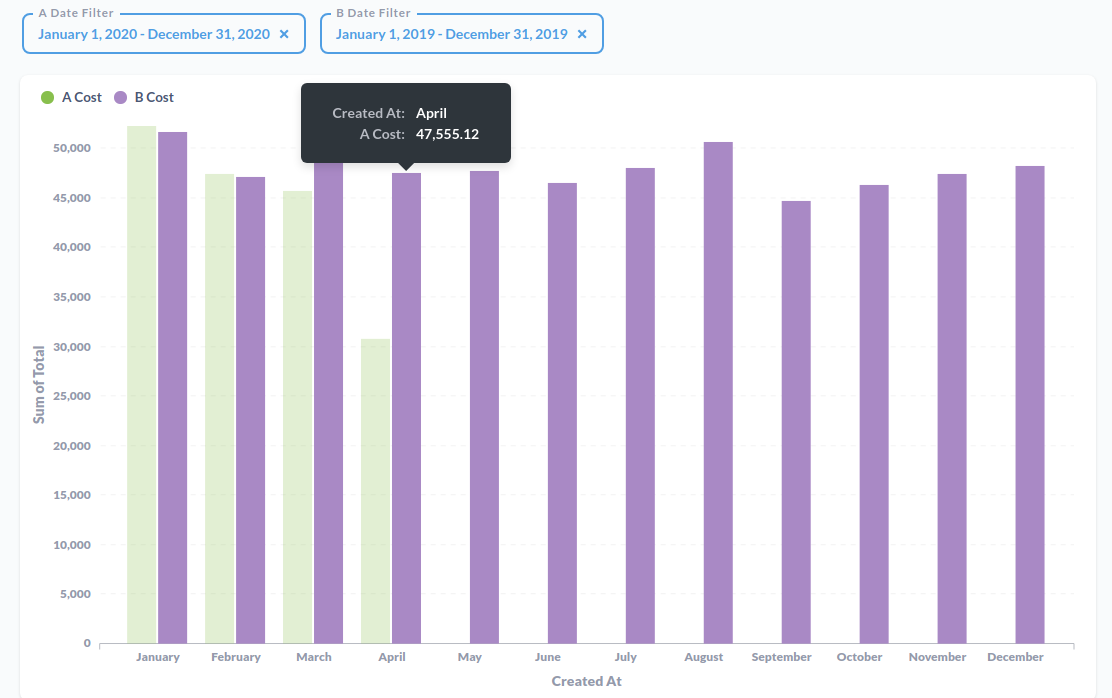
So basically if I have a series with multiple graphs only the first graph label will be displayed even when hovering on the second graph.
My use case is that I want to compare yearA with yearB where yearA and yearB are filters on essentially the same query.
But it looks really silly when you hover over and they both report as A.
Or is there another way of doing this that I am missing .....
TIA
Stephen
So my debug info:
{
"browser-info": {
"language": "en-GB",
"platform": "Linux x86_64",
"userAgent": "Mozilla/5.0 (X11; Linux x86_64) AppleWebKit/537.36 (KHTML, like Gecko) Chrome/91.0.4472.114 Safari/537.36",
"vendor": "Google Inc."
},
"system-info": {
"file.encoding": "UTF-8",
"java.runtime.name": "OpenJDK Runtime Environment",
"java.runtime.version": "11.0.11+9",
"java.vendor": "AdoptOpenJDK",
"java.vendor.url": "https://adoptopenjdk.net/",
"java.version": "11.0.11",
"java.vm.name": "OpenJDK 64-Bit Server VM",
"java.vm.version": "11.0.11+9",
"os.name": "Linux",
"os.version": "4.14.209-160.339.amzn2.x86_64",
"user.language": "en",
"user.timezone": "GMT"
},
"metabase-info": {
"databases": [
"h2",
"mysql"
],
"hosting-env": "unknown",
"application-database": "mysql",
"application-database-details": {
"database": {
"name": "MySQL",
"version": "5.7.33-log"
},
"jdbc-driver": {
"name": "MariaDB Connector/J",
"version": "2.6.2"
}
},
"run-mode": "prod",
"version": {
"date": "2021-07-14",
"tag": "v0.40.1",
"branch": "release-x.40.x",
"hash": "ed8f9c8"
},
"settings": {
"report-timezone": "Australia/Sydney"
}
}
}
How to re-create using sample data:
create a question like:
SELECT month("PUBLIC"."ORDERS"."CREATED_AT") AS "CREATED_AT", sum("PUBLIC"."ORDERS"."TOTAL") AS "sum"
FROM "PUBLIC"."ORDERS"
GROUP BY month("PUBLIC"."ORDERS"."CREATED_AT")
ORDER BY month("PUBLIC"."ORDERS"."CREATED_AT") ASC
(i used the gui this is the show sql)
visualise and create bar graph
call question A
save question
enter question A and duplicate it call it B
create dash D
add A to D
In dash D edit series of A and add B
For dash D add date filter and link to A
Add another filter and link to B
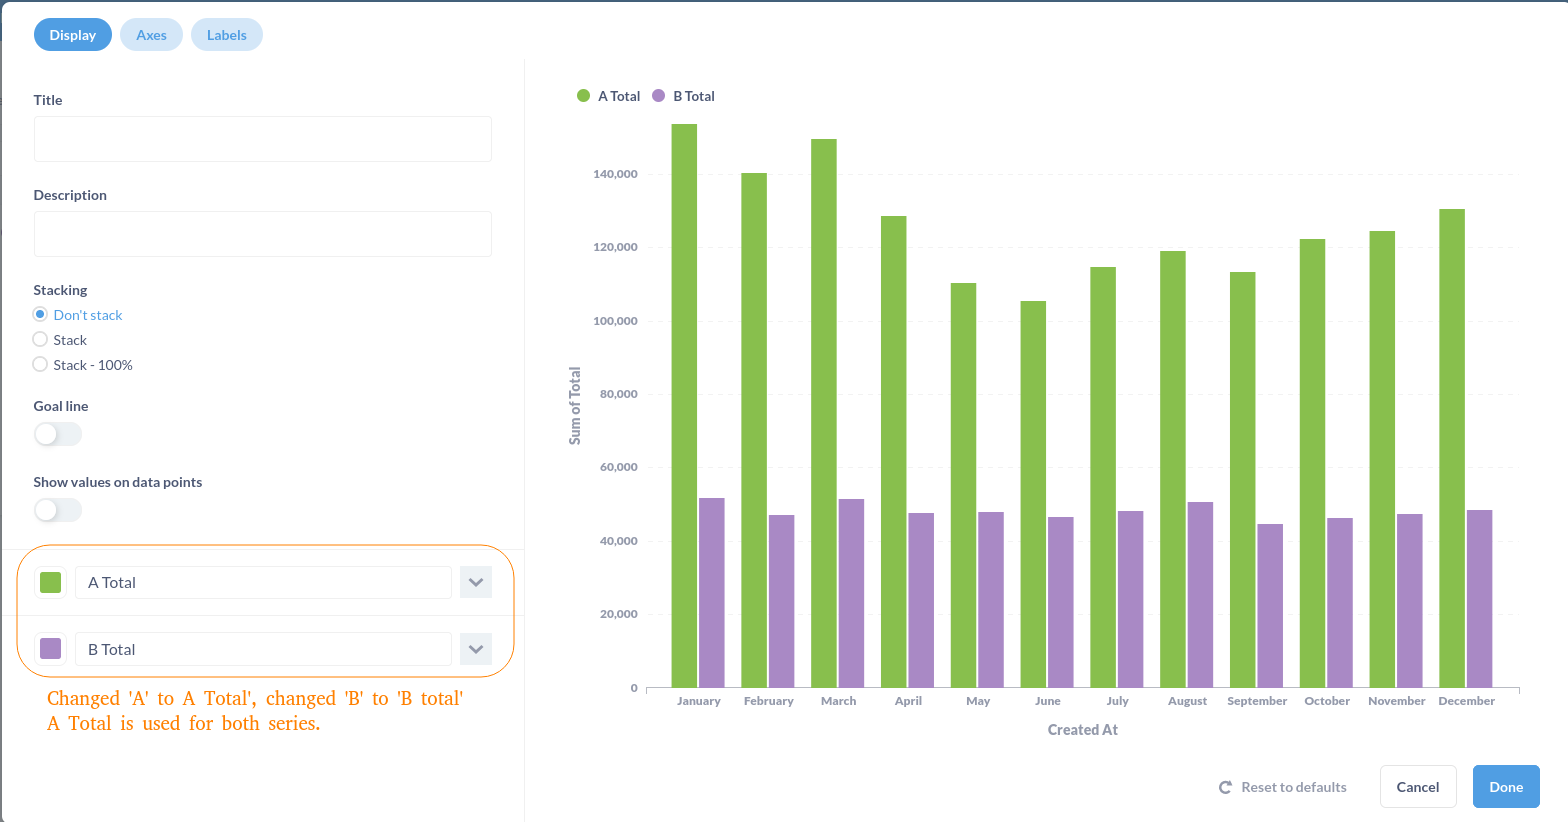
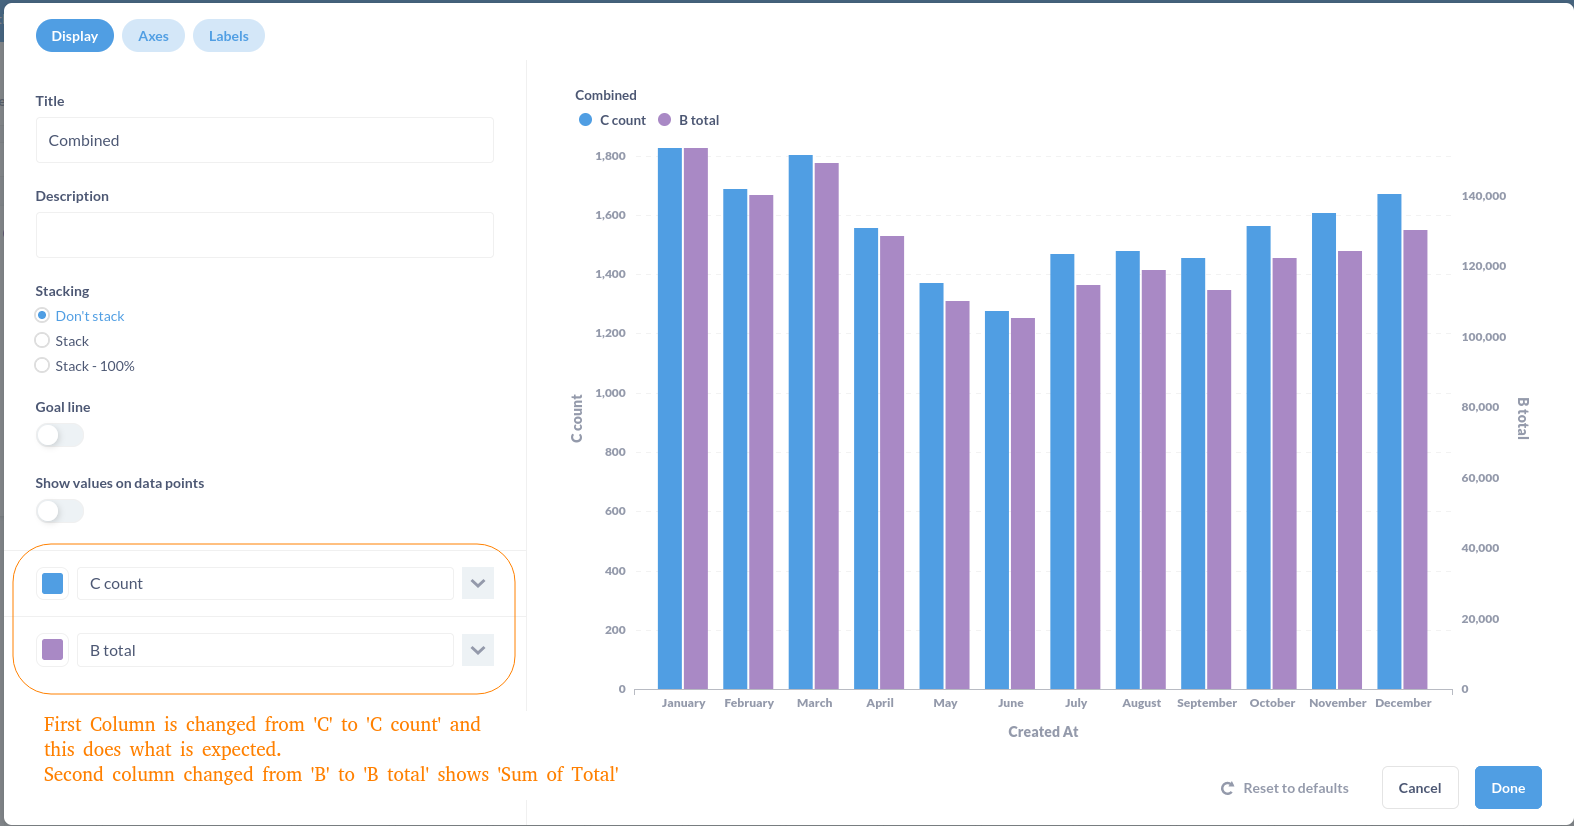
Goto visualise for the series and change the name of both series.
save everything and reload
when hovering over either bar you will only get the first label.
 on the first post