I have a stacked bar chart and I want to make a pie chart of each category from it.
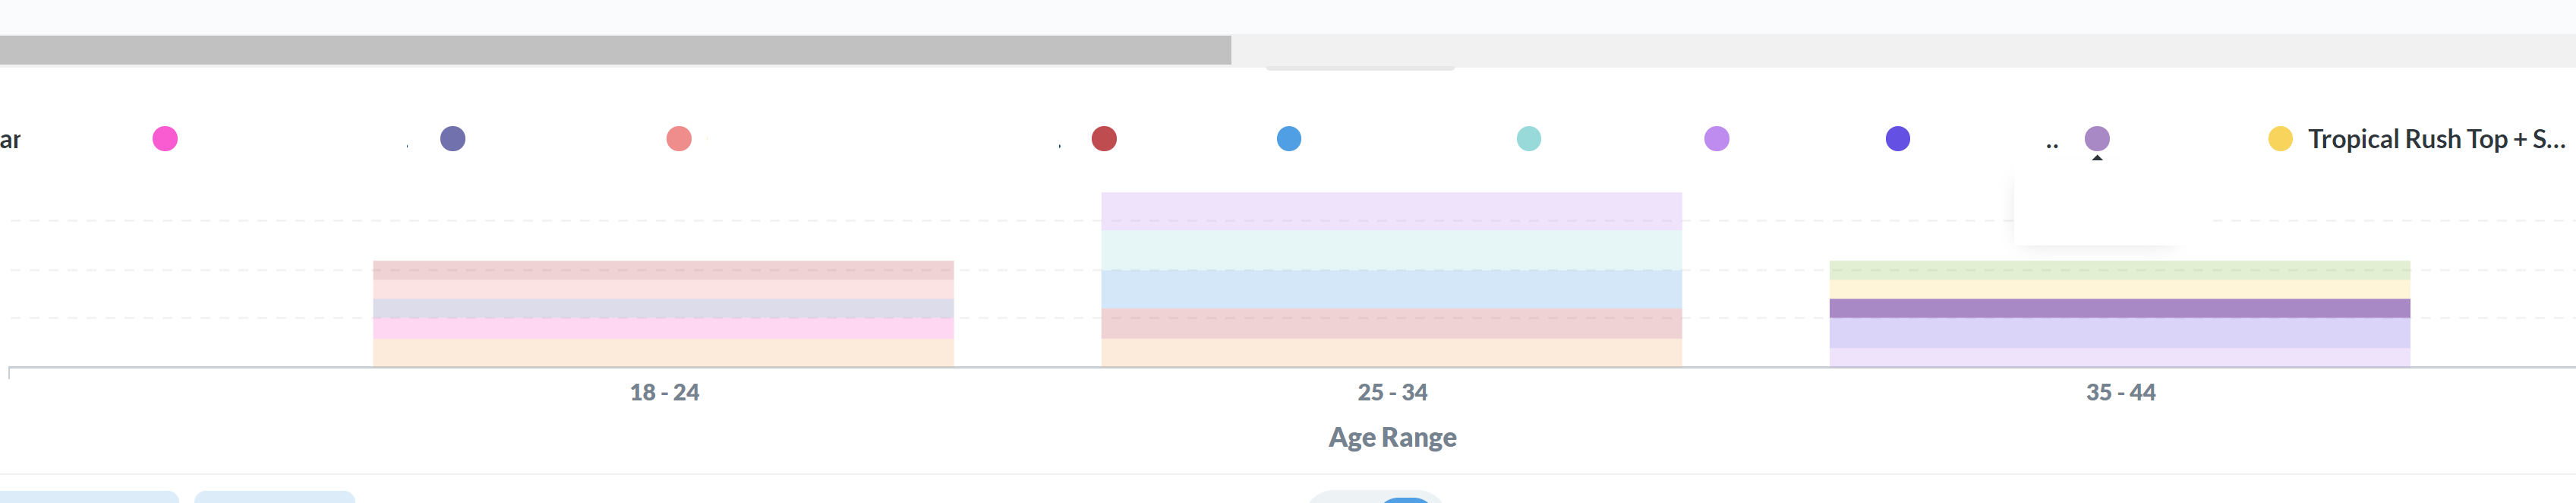
The orange one is the A. I want to make a pie chart for A that shows 18-24, and 25-34.
And do it for every product in the bar chart.
I have a stacked bar chart and I want to make a pie chart of each category from it.
The orange one is the A. I want to make a pie chart for A that shows 18-24, and 25-34.
And do it for every product in the bar chart.
Hi @Anum
Then you would filter the results, so you only get the data for each thing that you want to show in the Pie