Hey folks!
I have an issue with scatter plot, let's take the following example, which represent hours and values taken during that hour.
In order to make the graph always visually consistent, I want the x-axis (hours) to always have the same number of hours, so here 1, 2, 3, 4 even if there is no value for a specific hour.
select
    1 as hour, 10 as val
union all
    select    1, 12
union all
    select    1, 11
union all
    select    2, 13
union all
    select    3, 12
union all
    select    4, null
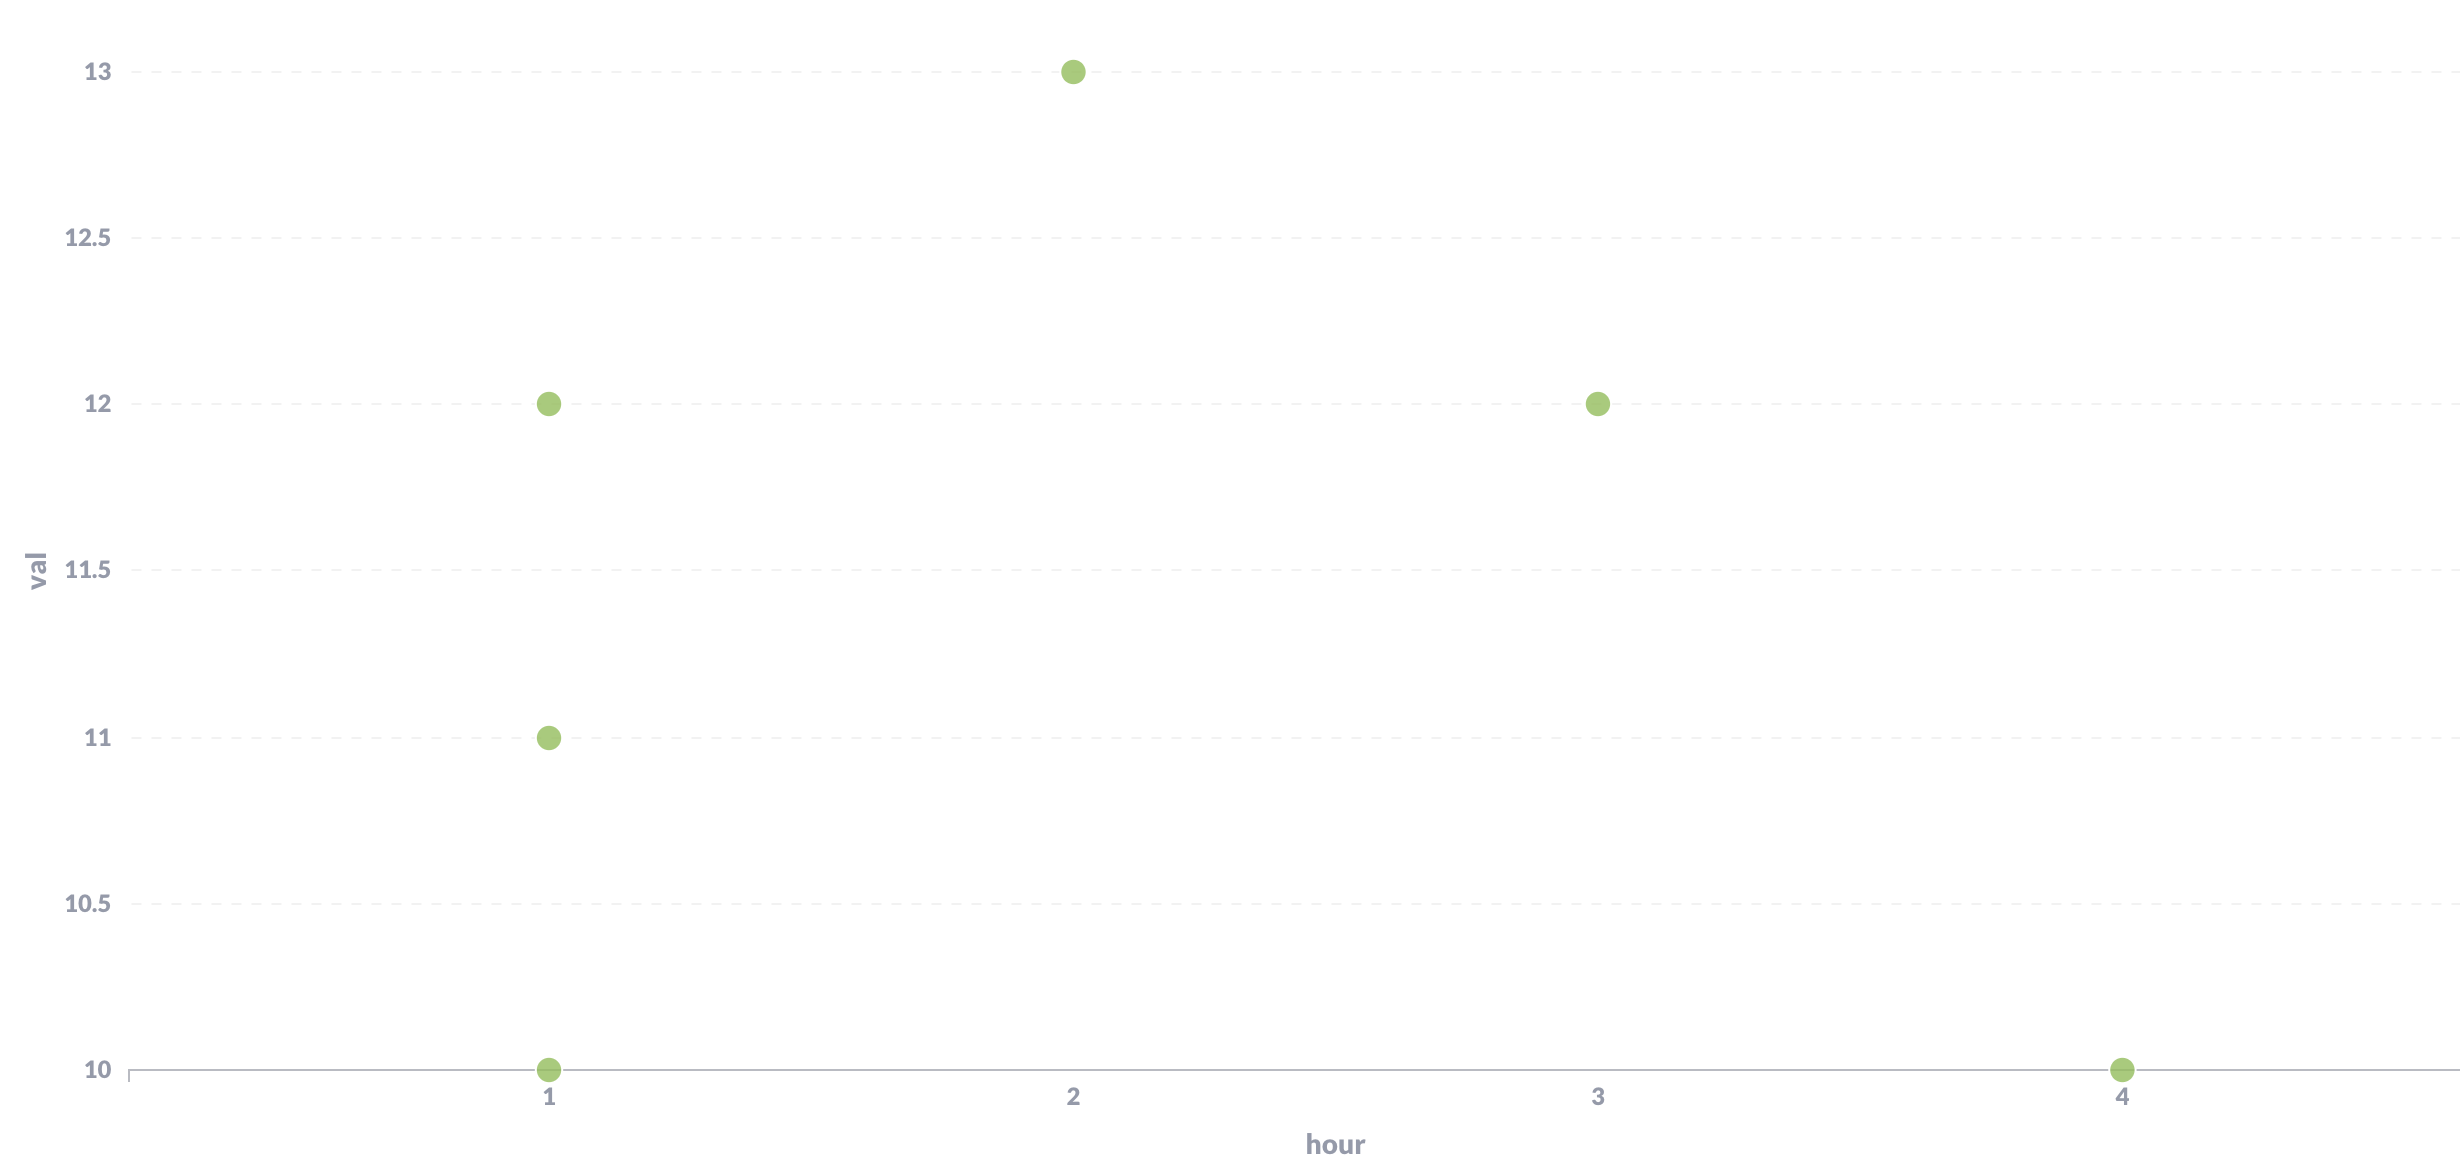
My issue is that when I'm trying to plot this, I have a data point at hour 4 (as shown on the figure above) but I want it to be empty, is there a way of achieving ?
Thank you ![]()