Hi Everyone- Good Morning,
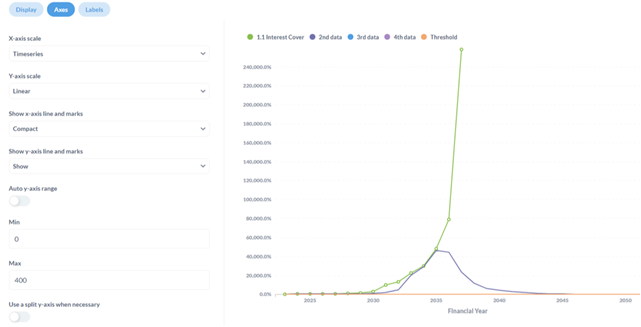
Could anyone please let me know whether it is possible to change manually Max and Min for the Y-axis of a Dashboard? The default Min and Max values are 0 and 400 respectively. When I increase the max value i.e greater than 400 the chart is updating(y-axis) but when I reduce the Max value i.e less than 400, the chart is not updating( no change on Y-axis). Is that an issue or do I need to do any changes?
 on the first post