We are seeing a higher number of cloud service credits associated with Metabase than we would expect given our current sync and scan settings. We're wondering whether there's an issue causing Metabase to run SHOW queries once per minute, instead of based on the admin sync settings. Example query:
show /* JDBC:DatabaseMetaData.getForeignKeys() */ imported keys in database "<our_database>"
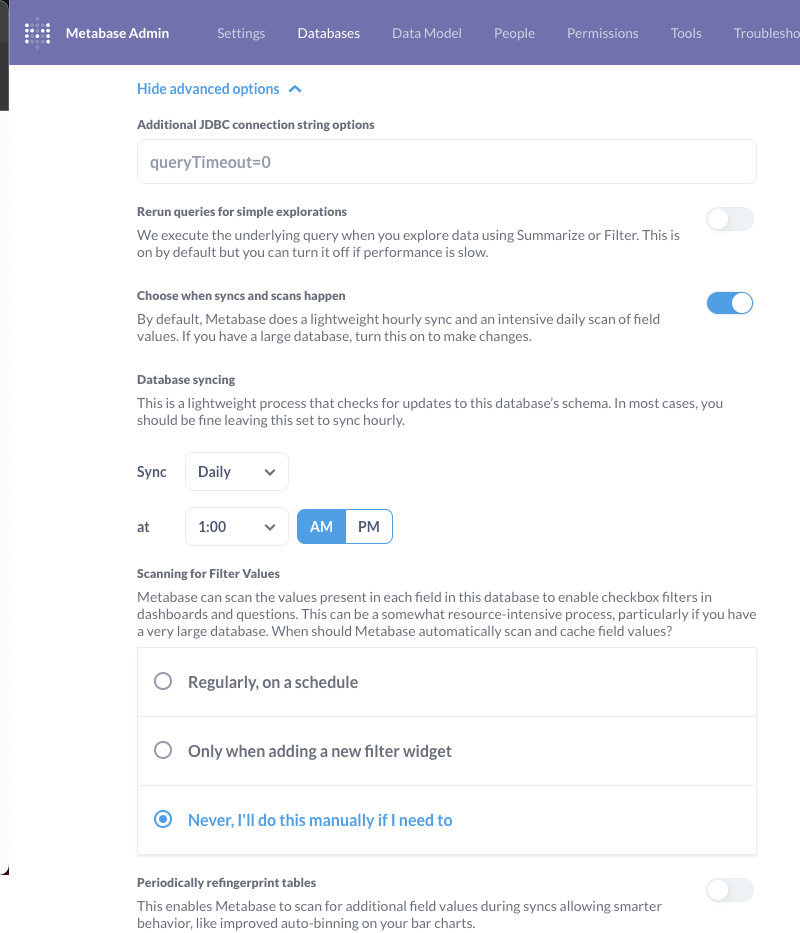
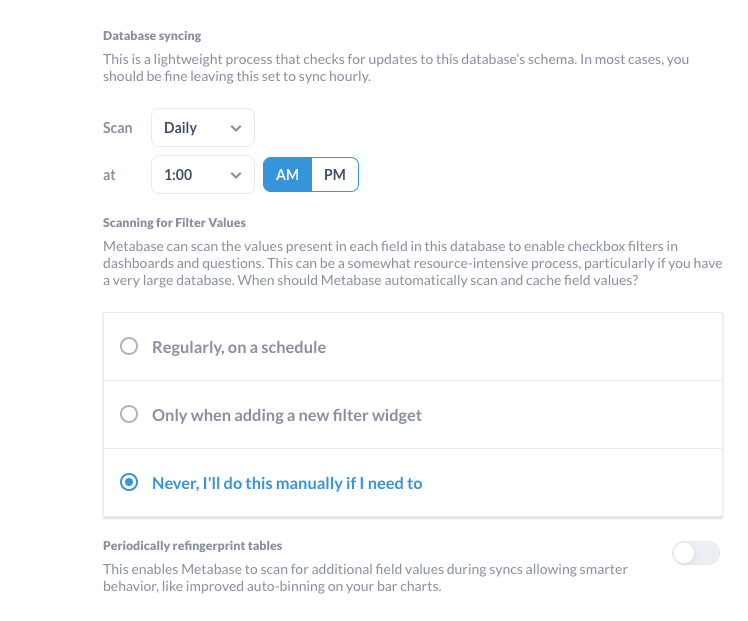
We are seeing this single query run 38827 times and use 35 cloud compute credits in February. Our settings are:
We've already tried excluding the largest schemas in our database and upgrading to the latest Metabase version, but didn't see any changes in our daily queries. We also turned off our Metabase to verify that we didn't have another account linked to the same warehouse (we don't ![]() ). Taking a look at the logs, there doesn't appear to be specific jobs/tasks running more than every hour. We do see pulses every hour, which is more frequent our daily database sync suggests, but is that normal?
). Taking a look at the logs, there doesn't appear to be specific jobs/tasks running more than every hour. We do see pulses every hour, which is more frequent our daily database sync suggests, but is that normal?
Here are the diagnostics:
{
  "browser-info": {
    "language": "en-US",
    "platform": "MacIntel",
    "userAgent": "Mozilla/5.0 (Macintosh; Intel Mac OS X 10_15_7) AppleWebKit/537.36 (KHTML, like Gecko) Chrome/111.0.0.0 Safari/537.36",
    "vendor": "Google Inc."
  },
  "system-info": {
    "file.encoding": "UTF-8",
    "java.runtime.name": "OpenJDK Runtime Environment",
    "java.runtime.version": "11.0.18+10",
    "java.vendor": "Eclipse Adoptium",
    "java.vendor.url": "https://adoptium.net/",
    "java.version": "11.0.18",
    "java.vm.name": "OpenJDK 64-Bit Server VM",
    "java.vm.version": "11.0.18+10",
    "os.name": "Linux",
    "os.version": "5.10.90+",
    "user.language": "en",
    "user.timezone": "GMT"
  },
  "metabase-info": {
    "databases": [
      "snowflake"
    ],
    "hosting-env": "unknown",
    "application-database": "postgres",
    "application-database-details": {
      "database": {
        "name": "PostgreSQL",
        "version": "13.7"
      },
      "jdbc-driver": {
        "name": "PostgreSQL JDBC Driver",
        "version": "42.5.0"
      }
    },
    "run-mode": "prod",
    "version": {
      "date": "2023-02-19",
      "tag": "v0.45.3",
      "branch": "release-x.45.x",
      "hash": "070f57b"
    },
    "settings": {
      "report-timezone": null
    }
  }
}
Here are other topics that we have looked into:
- Hourly DB hit that is NOT our scheduled scan or sync - #3 by TropicalTomboy
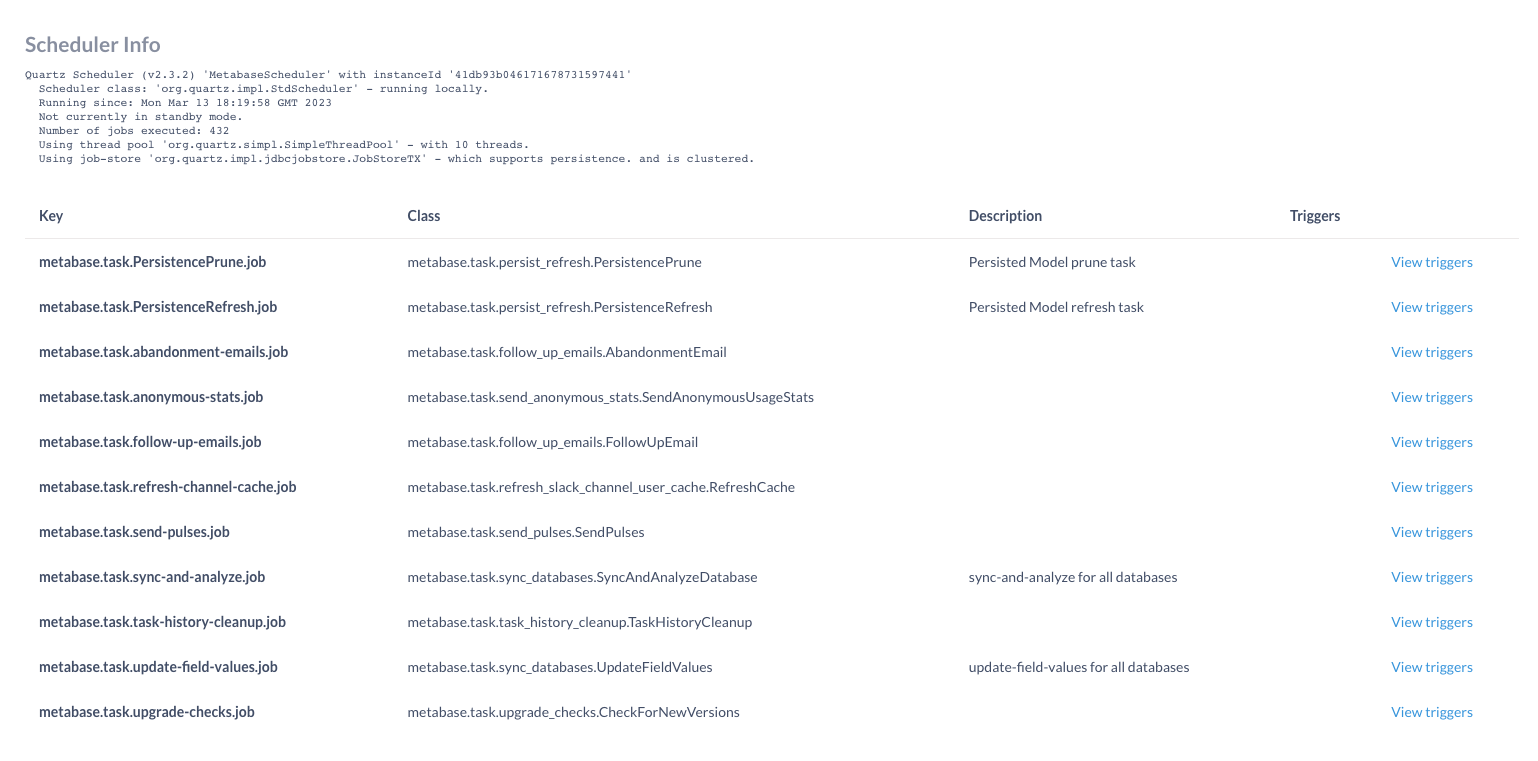
- Based on the responses there, it also doesn't seem like a Jobs issue, but in case, here are our jobs:
- Based on the responses there, it also doesn't seem like a Jobs issue, but in case, here are our jobs:
- Metabase sync costing $500 / month in snowflake credits - #9 by danwolch
- This issue does seem similar to ours, though not quite as frequent as reported there. Is our solution to disable syncs as well?
- Disable Database Sync or Allow Weekly Syncs · Issue #10398 · metabase/metabase · GitHub