Metabase v0.36.4 being stuck regularly

Hi,

We’ve been using v0.36.4 for 3 weeks now in the company and it eliminated our previous issue with v0.33.3 on metabase getting stuck randomly needing us to hard restart it every time. Today, we just encountered this very similar issue twice and my guess is that it has something to do with our new slow dashboard.

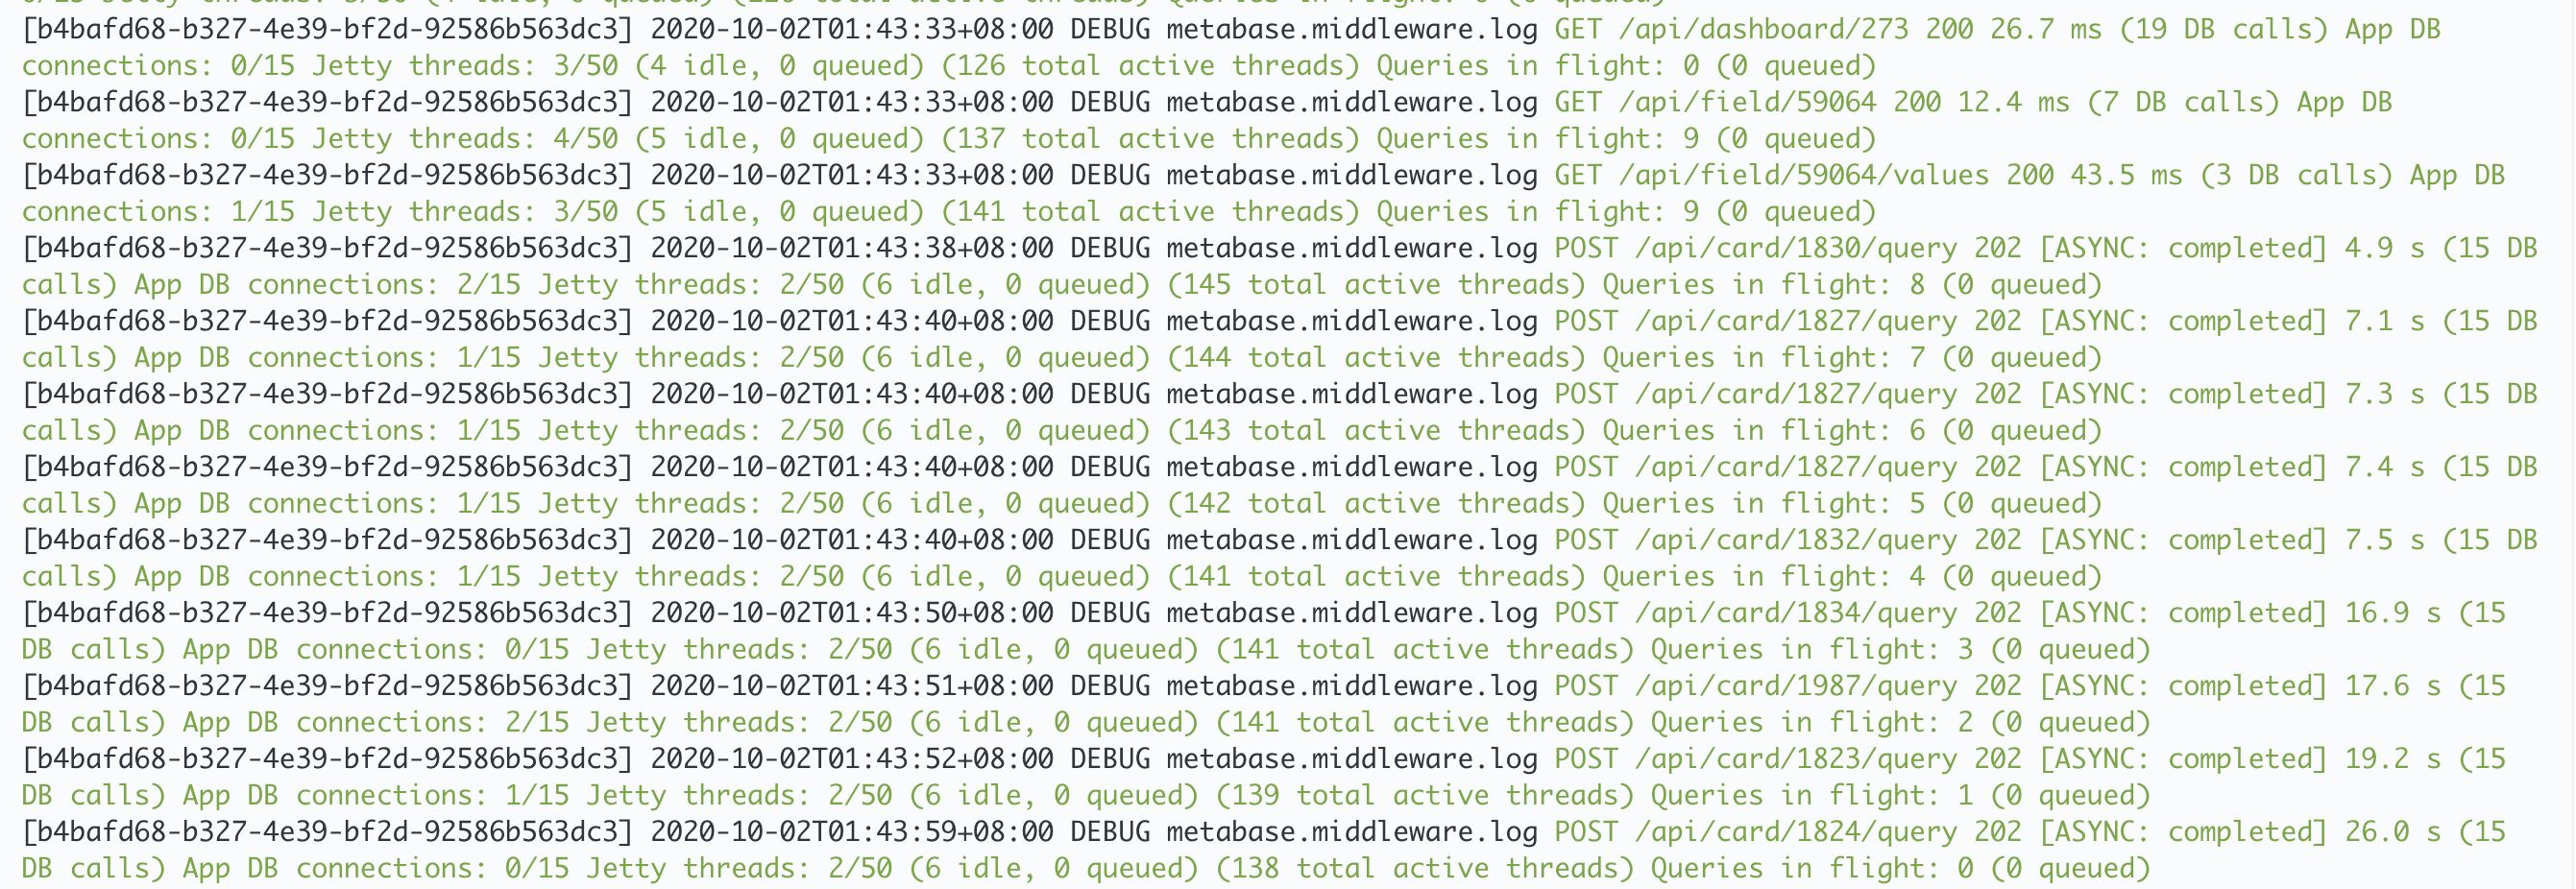
During the issue, this is how the logs looks like:

[581a0491-fc85-47c3-bbe4-60422d2642ea] 2020-10-01T16:41:13+08:00 DEBUG metabase.middleware.log GET /api/database 200 348.6 ms (4 DB calls) App DB connections: 0/15 Jetty threads: 20/50 (14 idle, 0 queued) (381 total active threads) Queries in flight: 50 (8 queued)

No query are being executed o our Redshift Data Warehouse and only a hard restart of the metabase docker-container fixed it.

As far as I know, this is a problem with our metabase set-up and I want to consult you guys on several things for me to figure out how to scale metabase on our end.

  1. How to read the logs above?

0/15 APP DB connections - 0 connections on Metabase Postgres DB
20/50 Jetty Threads - I assume this is the connection thread going to our Redshift instance? I’ve used the environment variable MB_JDBC_DATA_WAREHOUSE_MAX_CONNECTION_POOL_SIZE to configure it to 50.
381 total active threads - I don’t have any idea about this.
50 queries in flight - Metabase thinks that it’s currently running 50 queries even though nothing is appearing in Redshift. But not sure how is this related to 381 total active threads or even at 20/50 jetty threads.
8 queued - I’m assuming here that 50 queries in flight is the maximum for metabase and any new requests will be queued and in this case it’s 8.

  1. Is there any way for me to increase the maximum queries in flight? Increase memory? Increase CPU? Or is it just better to horizontally scale in this case?

Diagnostic Info:

    {
      "browser-info": {
        "language": "en",
        "platform": "MacIntel",
        "userAgent": "Mozilla/5.0 (Macintosh; Intel Mac OS X 10_15_5) AppleWebKit/605.1.15 (KHTML, like Gecko) Version/13.1.1 Safari/605.1.15",
        "vendor": "Apple Computer, Inc."
      },
      "system-info": {
        "file.encoding": "UTF-8",
        "java.runtime.name": "OpenJDK Runtime Environment",
        "java.runtime.version": "11.0.8+10",
        "java.vendor": "AdoptOpenJDK",
        "java.vendor.url": "https://adoptopenjdk.net/",
        "java.version": "11.0.8",
        "java.vm.name": "OpenJDK 64-Bit Server VM",
        "java.vm.version": "11.0.8+10",
        "os.name": "Linux",
        "os.version": "5.3.0-1035-aws",
        "user.language": "en",
        "user.timezone": "Asia/Kuala_Lumpur"
      },
      "metabase-info": {
        "databases": [
          "postgres",
          "redshift"
        ],
        "hosting-env": "unknown",
        "application-database": "postgres",
        "application-database-details": {
          "database": {
            "name": "PostgreSQL",
            "version": "9.6.14"
          },
          "jdbc-driver": {
            "name": "PostgreSQL JDBC Driver",
            "version": "42.2.8"
          }
        },
        "run-mode": "prod",
        "version": {
          "date": "2020-08-17",
          "tag": "v0.36.4",
          "branch": "release-0.36.x",
          "hash": "196c1f6"
        },
        "settings": {
          "report-timezone": "Asia/Kuala_Lumpur"
        }
      }
    }

Hardware:

  • Single AWS EC2 instance m5a.large
  • Docker Container
  • 2 cores, 8gb memory

Environment Variables:

  • JAVA_TIMEZONE: Asia/Kuala_Lumpur
  • JAVA_TOOL_OPTIONS: -Xmx6g
  • MB_JDBC_DATA_WAREHOUSE_MAX_CONNECTION_POOL_SIZE: 30

We’ve also turned off caching for now because of https://github.com/metabase/metabase/issues/13164.

Sorry for the lengthy post and thanks in advanced!

Hi @nmcalabroso-ms

How many cards do you have on the dashboard?
How many connections do you allow on Redshift?

The MB_JDBC_DATA_WAREHOUSE_MAX_CONNECTION_POOL_SIZE is the maximum number of connection per database.

And the Queries in flight is the amount of data warehouse queries that Metabase is currently processing, not necessarily the number of queries actually running on a data warehouse. Some of them will be in Clojure-land, waiting for a data warehouse DB connection. Others might be in Clojure-land going thru the pre-processing pipeline.
This is aggregated for all databases, despite that each data source has it’s own connection pool size.

Thanks @flamber!

Just 9 cards. But it’s really slow even outside of metabase resulting for some people to refreshing repeatedly.

Maximum number of connections in redshift, by default, is 500 but it can only accommodate 50 concurrent queries.

Thanks for clarifying the Queries in Flight. I think I did an error in my post. I’ve set MB_JDBC_DATA_WAREHOUSE_MAX_CONNECTION_POOL_SIZE to 30 and not 50 so I don’t think it’s directly related to the number of Jetty Threads.

I’m not sure if increasing memory would solve this issue for us since the instance is at 65% RAM usage through out the day even during the stuck issue.

@nmcalabroso-ms
When people refresh, then it should cancel those requests, so that shouldn’t be a problem.
You should see that from the log.

You might want to add a textbox at the top of the dashboard with a little note on how long it takes to load the dashboard and if they refresh will just make it start over.

Database connection pool and Jetty is totally unrelated. And it’s not a memory issue.

How many databases have you configured in Admin > Databases?
Remember that the Queries in flight is cumulative of all pools, so that makes it a lot harder to see if you’re hitting the limit of a single pool (30), which would mean that Metabase would queue queries until there’s a free connection in the pool.

Also, your initial log line shows that you’re already having 58 queries to your data sources, when the user opens the dashboard, which will just add another 9.

Do you have filters on the dashboard, and do they have default values? Asking, since I have a feeling that you might be seeing this:
https://github.com/metabase/metabase/issues/13150

1 Like

Thanks for the advice @flamber. For now, we've archived this dashboard to confirm that this is indeed causing our issues.

How many databases have you configured in Admin > Databases?

We just have 2 active databases - Redshift Data Warehouse and Metabase App DB.

Asking, since I have a feeling that you might be seeing this:

Yeah I think you're right. I just tested now with me being the only user of metabase and saw this in our log.


Just a screenshot since I cannot format the logs here properly. There were few duplicate requests for the same card, 1827 in this case. I also saw lots of :class org.eclipse.jetty.io.EofException.

We have 5 filters. 2 filters has default values. 1 is for the date (previous 30 days) and another one for a Category that currently has single value.

From the frontend, seems like some API calls (POST requests to /api/card/1827/query) are getting cancelled immediately anyway.

If requests are getting cancelled, then it shouldn't overwhelm metabase right?

For now, I'll monitor the github issue you mentioned. Thanks a lot.

@nmcalabroso-ms I don’t know how many users you have visiting at the same time, but given that you have 20 active Jetty threads, and I presume that you’re using https over HTTP/2, then I guess there are a lot of activity. So when there’s a bunch of extra requests (even if they get cancelled), that will still add extra load.
And then if you also have people editing the dashboard, then you might be hit by this too:
https://github.com/metabase/metabase/issues/12926 - upvote by clicking :+1: on the first post