Depending on the width of the screen, a card on my dashboard is being displayed in the following two formats:
In the second case, only one of the dates is being shown, while clearly there is still room for more. I was wondering whether I'm missing something or this is a bug.
Hi @King_Edward
I cannot see if you’re showing on the dashboard, but I guess you are.
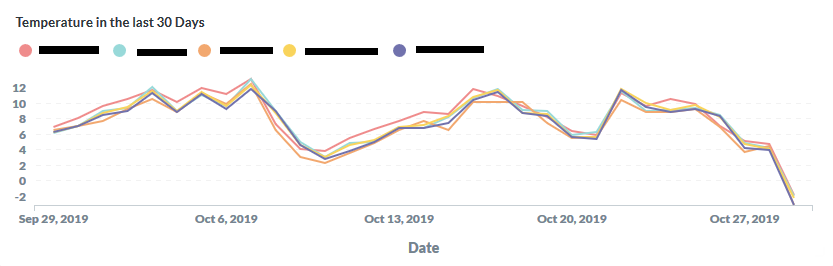
Currently, when a card is not the full with, then it shows less (or sometimes none) of the ticks.
There’s work being done, so it’s less aggressive when hiding the ticks.
https://github.com/metabase/metabase/issues/11158 - go upvote by clicking  on the first post.
1 Like

 on the first post.