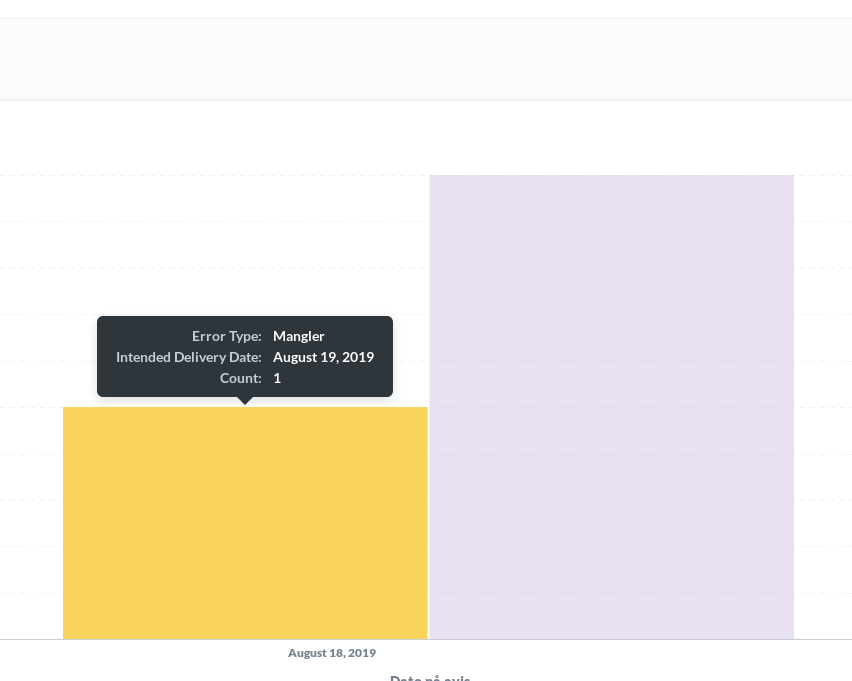
My data is not accurately displayed. Its an issue in the chart view and also from the dashboard where I'm using a date range to narrow down the scope of the figure. The data has date stamp 19-08-2019 but the x-axis shows august 18.
Is there anything I can do to fix this? I would prefer that each group of columns were given its specific date.