@paulrosenzweig is currently guessing that this is the same root cause as https://github.com/metabase/metabase/issues/10818, which should be fixed by https://github.com/metabase/metabase/pull/10827, but we’re not 100% sure yet.
Hi @maz
Thanks for the help. I think it should be the same issue, at least they look similar. As an update, our dashboards are still messy today. Hopefully we could figure this out soon, otherwise, I will need to update all queries and put time as the first row after select 
Also seeing this for our Metabase instance.
I'm seeing an issue when visualising dates, but not matching any description/screenshot above, so not sure it's related or not.
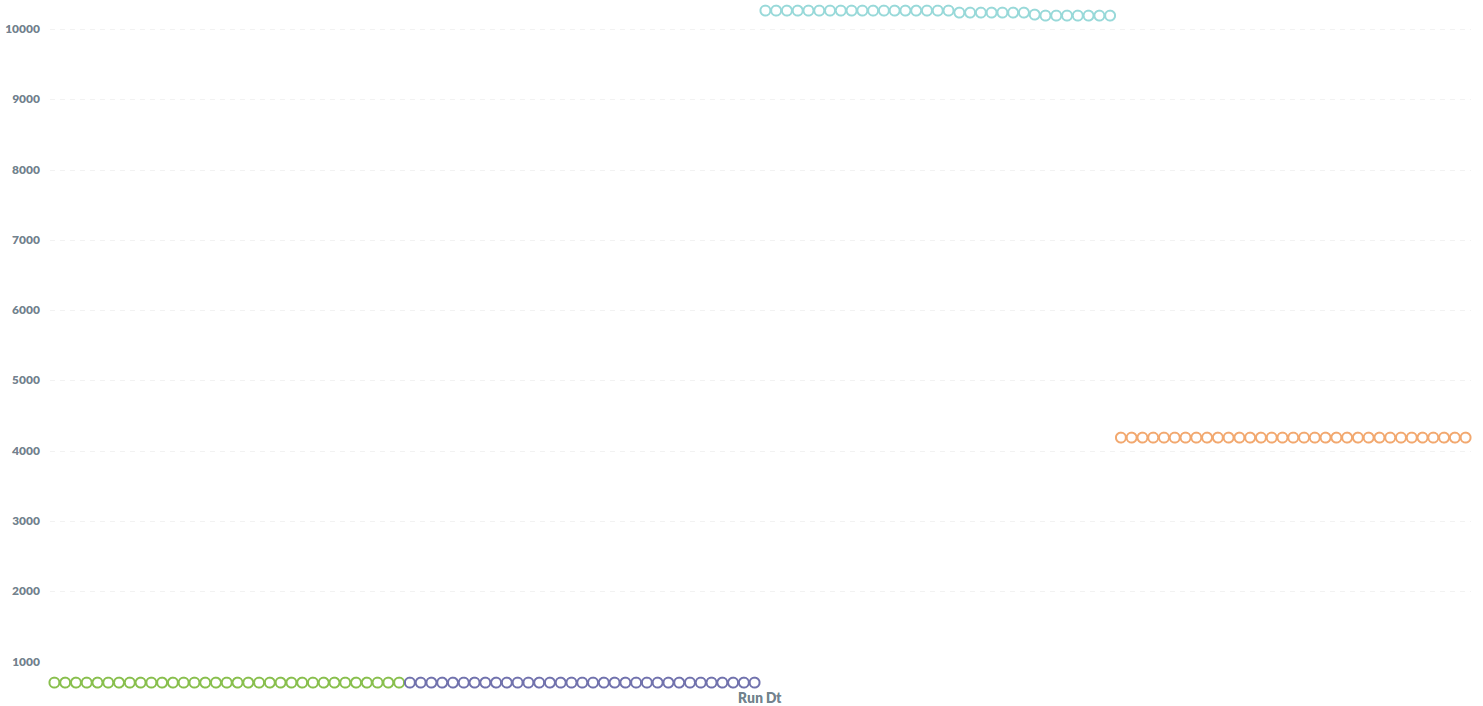
Most/all of our charts are now empty since upgrading to 0.33.2, and show a date of 1970, suggesting an error reading/processing the date:
We have a MySQL table with data that Metabase can display fine, and dates are in standard DATETIME format.
Here's a video showing the broken charts, and how to get them working again (remove some columns from table view, then go back to line view - then I can re-add all the columns to table view, and the line chart still works) - there's no logic to this, but hopefully the video will give some pointers.
I think I may also be seeing this or a related issue - Im using 0.33.2 but with data in a SQLLITE db. Timeseries data will not render whether using Simple or native query. I know SQLLITE can be a bit funky wrt dates/times but thought I’d mention in case its related…
There’s currently three issues - somewhat related - that are tracking these chart issues in 0.33.2:
https://github.com/metabase/metabase/issues/10818
https://github.com/metabase/metabase/issues/10840
https://github.com/metabase/metabase/issues/10862
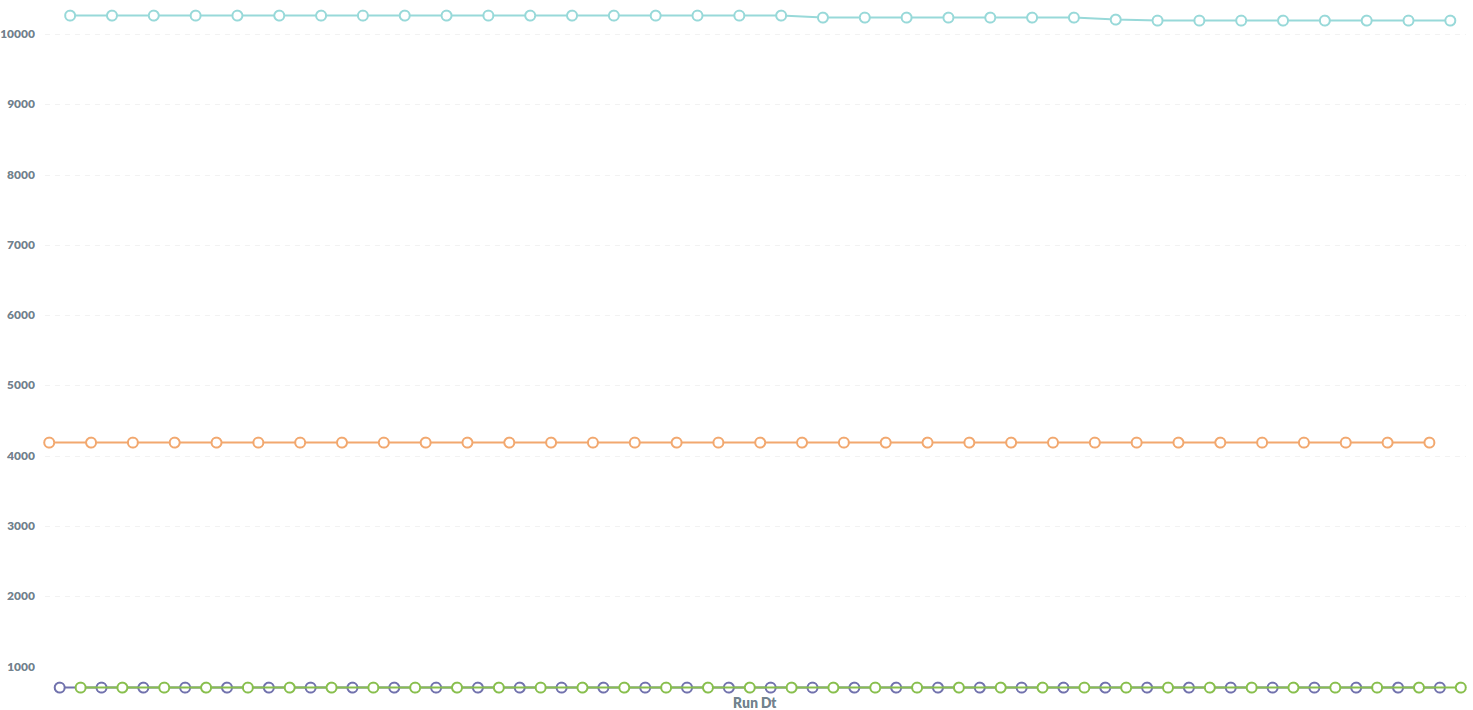
Thank you @flamber. Relocating the timeseries column to be the first column and sorting by it (time series data is not recognized - empty chart is rendered · Issue #10862 · metabase/metabase · GitHub) helped things. However if the data contains a subseries and the data is FIRST sorted by that field (as well as the timeseries column) then the rendering of each series gets skewed.