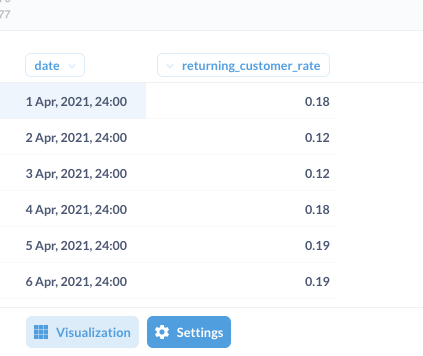
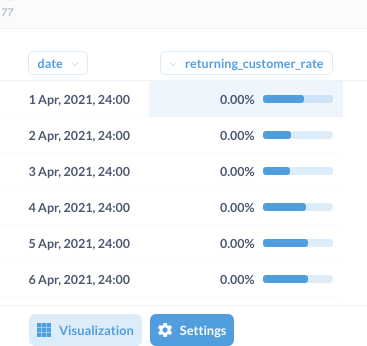
Currently I'm having the problem provided in the screenshots below where visualisations show all values as 0 but the graphs still follow the query's value. Is this a bug? Or am I doing something wrong
Currently I'm having the problem provided in the screenshots below where visualisations show all values as 0 but the graphs still follow the query's value. Is this a bug? Or am I doing something wrong
Hi @natti
Post "Diagnostic Info" from Admin > Troubleshooting.
And please show the visualization settings for that column.