Hi @flamber,
Thanks for the quick response and the tip on formatting!
The database being accessed is sick_il_services joined with a table in sick_il_aap.
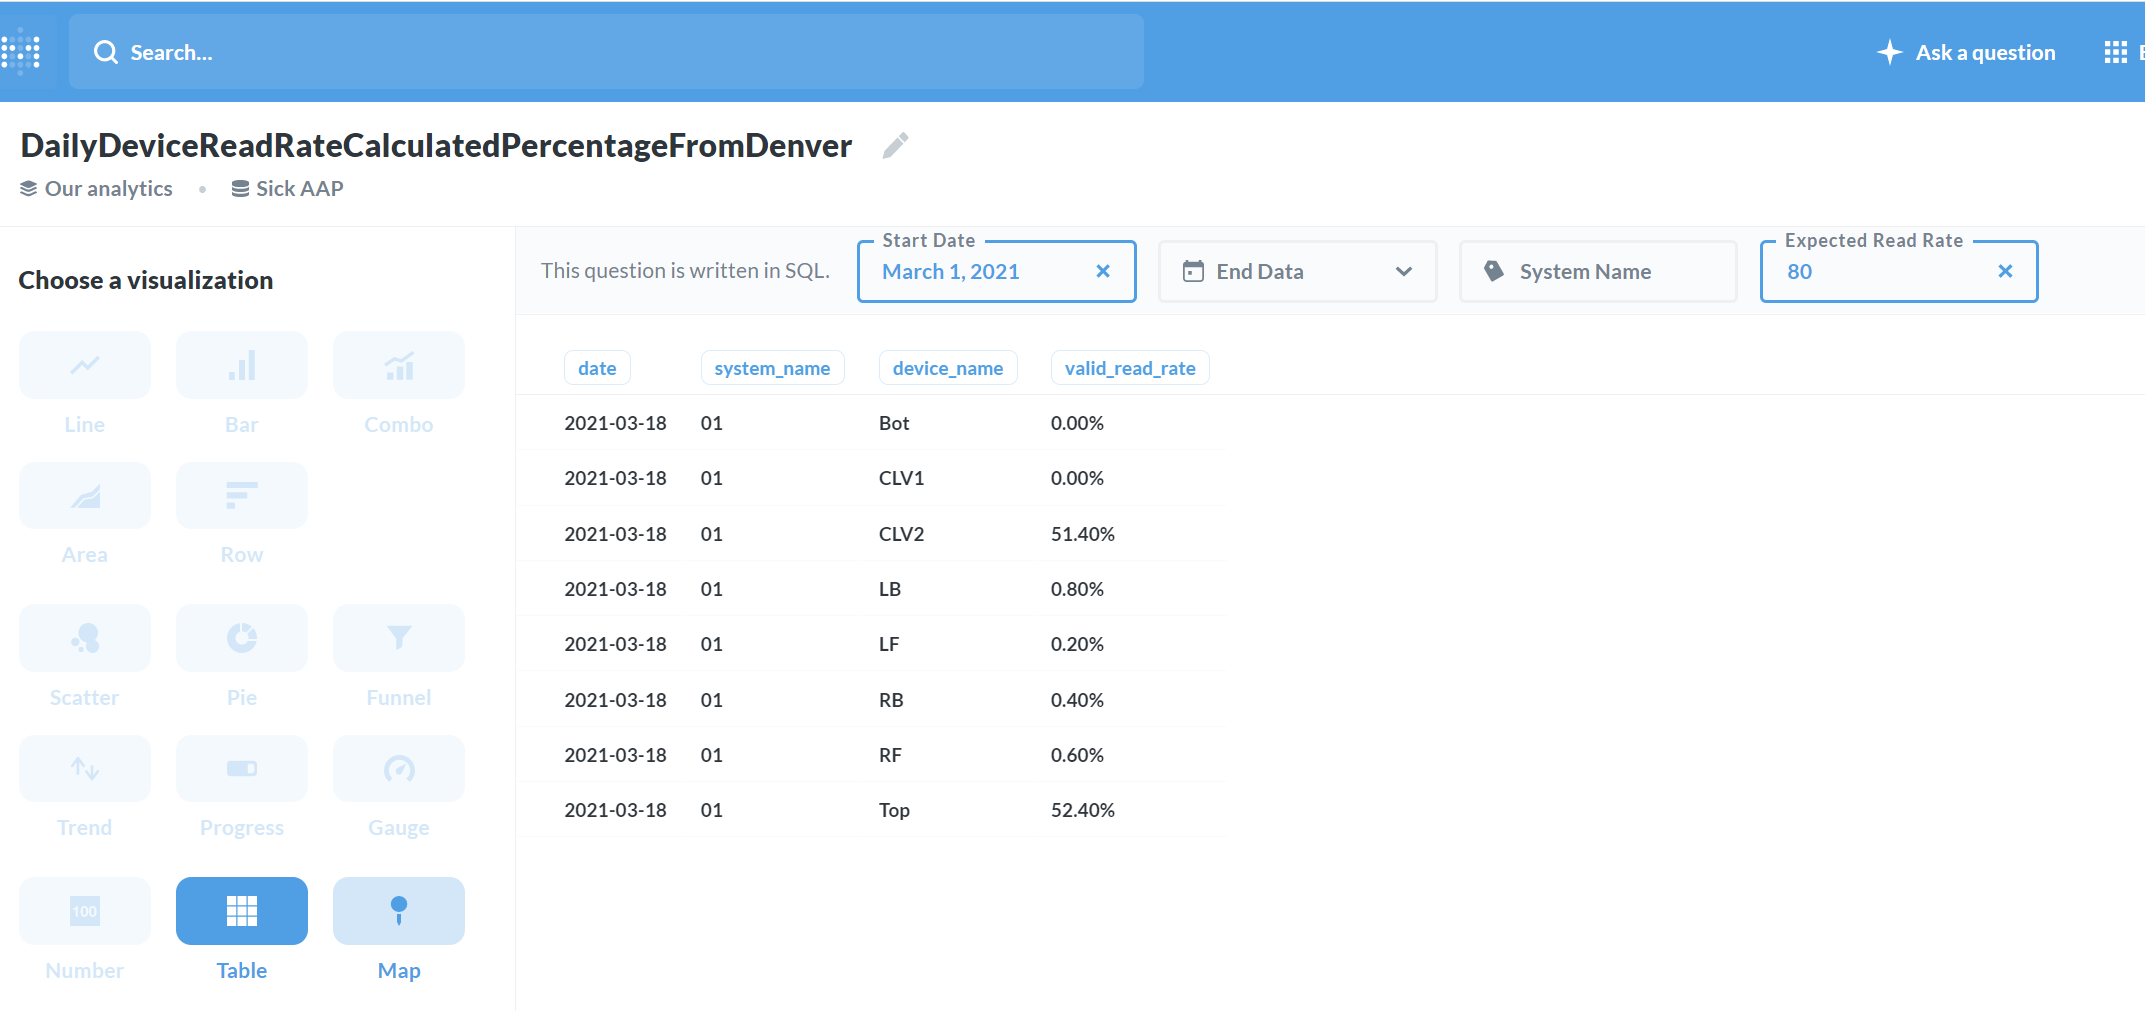
Here is a screenshot - as you can see, the visualization options are dimmed out:
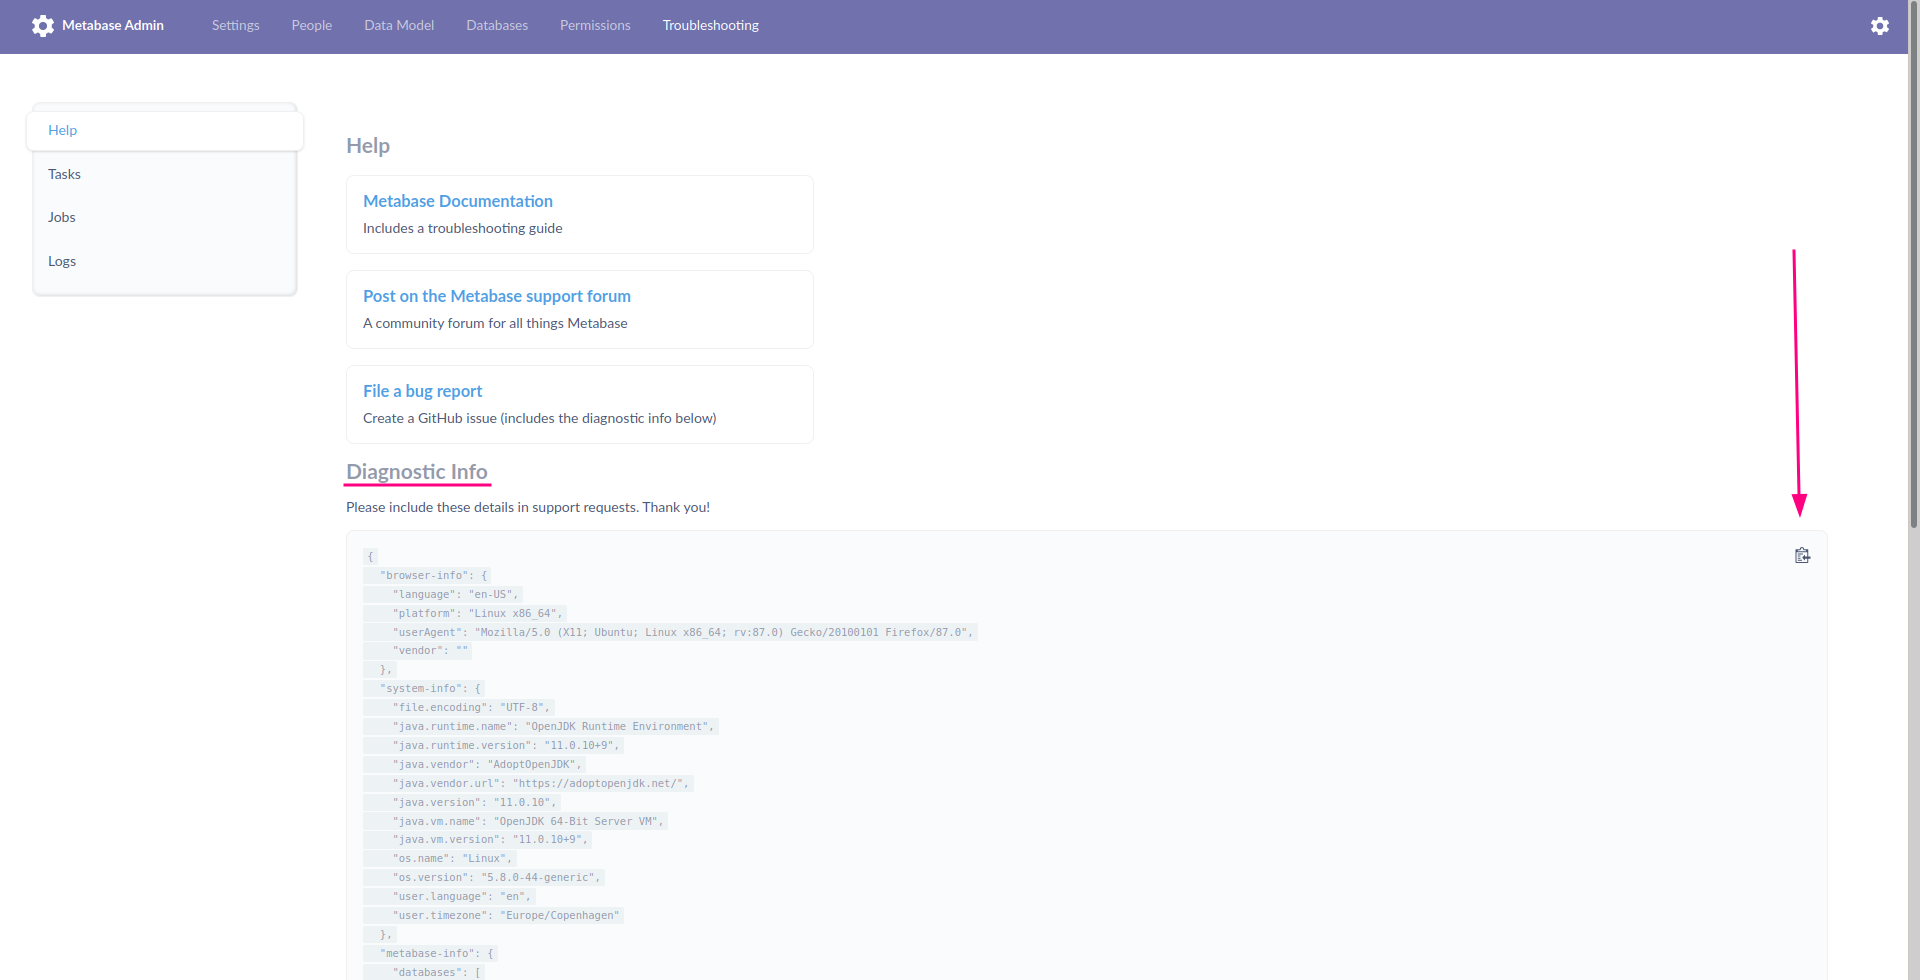
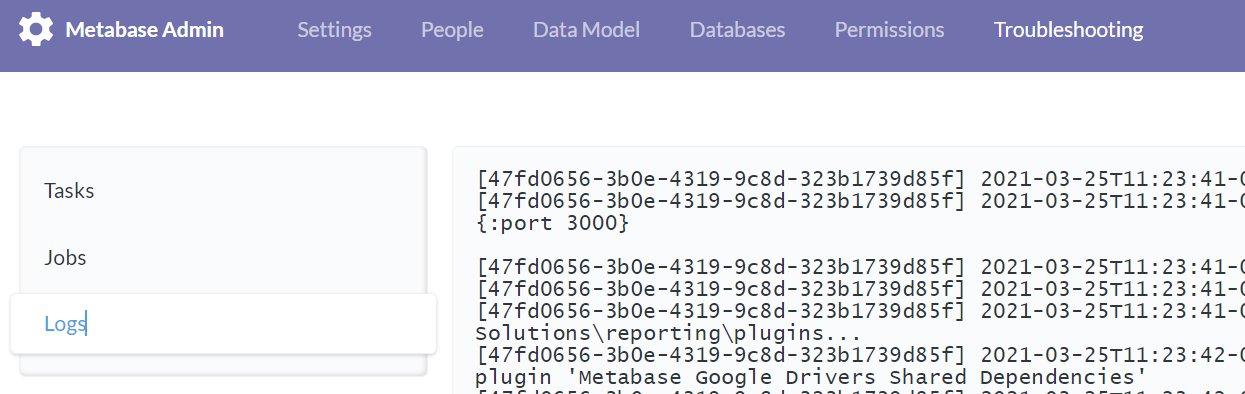
I don't see an option for "Diagnostic Info" in the Admin > Troubleshooting section, just "Tasks", "Jobs" and "Logs". Here's the end of the last log:
{:type "native",
:native
{:query
"select date, system_name, device_name, valid_read_rate from \r\n(SELECT left(from_unixtime(c.capture_time/1000),10) as date, a.name as 'system_name', b.name as 'device_name', c.read_count, c.valid_object_count, \r\nif(valid_object_count = 0,'00.00%',concat(format(read_count/valid_object_count100,2),'%')) as valid_read_rate, read_count/valid_object_count100 as valid_read_rate_unformatted\r\nFROM sick_il_services.system_config a\r\njoin sick_il_services.system_device b\r\non a.id = b.system_id\r\njoin sick_il_aap.daily_device_read_rate c\r\non b.id = c.device_id\r\nwhere 1=1\r\n[[AND c.capture_time >= unix_timestamp(concat({{start_date}}, ' 00:00:00.000')) * 1000 ]]\r\n[[AND c.capture_time <= unix_timestamp(concat({{end_date}}, ' 23:59:59.999')) * 1000]]\r\n[[AND a.name = '{{system_name}}']]\r\ngroup by c.capture_time,a.name, b.name\r\norder by c.capture_time, a.name, b.name) as sub\r\nwhere sub.valid_read_rate_unformatted < {{expected_read_rate_percent}}",
:template-tags
{:start_date {:id "c617fe80-ac55-8578-549b-0fd8f43a015a", :name "start_date", :display-name "Start Date", :type "date", :required true},
:end_date {:id "c1e08118-d687-a293-6430-ead9a6fa948f", :name "end_date", :display-name "End Data", :type "date"},
:system_name {:id "b9f0e20e-2ce5-8cc7-9b97-8e463e31a407", :name "system_name", :display-name "System Name", :type "text"},
:expected_read_rate_percent {:id "c7d91d4a-bee2-97b7-30d1-4eca4c9ed6b9", :name "expected_read_rate_percent", :display-name "Expected Read Rate", :type "number", :required true}}},
:parameters [{:type "date/single", :target ["variable" ["template-tag" "start_date"]], :value "2021-03-01"}],
:async? true,
:middleware {:add-default-userland-constraints? true, :userland-query? true},
:info
{:executed-by 1,
:context :ad-hoc,
:card-id nil,
:nested? false,
:query-hash [107, 47, 55, -27, 78, 3, -101, -40, -20, 48, -66, -79, -10, 121, -25, -24, -104, 14, 116, 13, -62, -57, -110, 87, -91, -68, 13, -108, -55, -77, -60, -90]},
:constraints {:max-results 10000, :max-results-bare-rows 2000}}}
[47fd0656-3b0e-4319-9c8d-323b1739d85f] 2021-03-25T14:26:33-04:00 DEBUG metabase.middleware.log POST /api/dataset 200 [ASYNC: completed] 116.5 ms (9 DB calls) Jetty threads: 3/50 (3 idle, 0 queued) (75 total active threads) Queries in flight: 0
[47fd0656-3b0e-4319-9c8d-323b1739d85f] 2021-03-25T14:26:39-04:00 DEBUG metabase.middleware.log POST /api/dataset 200 [ASYNC: completed] 99.6 ms (9 DB calls) Jetty threads: 3/50 (3 idle, 0 queued) (76 total active threads) Queries in flight: 0
[47fd0656-3b0e-4319-9c8d-323b1739d85f] 2021-03-25T14:26:46-04:00 DEBUG metabase.middleware.log GET /api/session/properties 200 2.9 ms (1 DB calls) Jetty threads: 5/50 (2 idle, 0 queued) (76 total active threads) Queries in flight: 0
[47fd0656-3b0e-4319-9c8d-323b1739d85f] 2021-03-25T14:26:46-04:00 DEBUG metabase.middleware.log GET /api/setting 200 702.1 µs (0 DB calls) Jetty threads: 5/50 (2 idle, 0 queued) (77 total active threads) Queries in flight: 0
[47fd0656-3b0e-4319-9c8d-323b1739d85f] 2021-03-25T14:26:46-04:00 DEBUG metabase.middleware.log GET /api/setup/admin_checklist 200 41.3 ms (11 DB calls) Jetty threads: 5/50 (2 idle, 0 queued) (77 total active threads) Queries in flight: 0
[47fd0656-3b0e-4319-9c8d-323b1739d85f] 2021-03-25T14:27:58-04:00 DEBUG metabase.middleware.log GET /api/task 200 48.2 ms (2 DB calls) Jetty threads: 4/50 (3 idle, 0 queued) (75 total active threads) Queries in flight: 0
[47fd0656-3b0e-4319-9c8d-323b1739d85f] 2021-03-25T14:28:49-04:00 DEBUG metabase.middleware.log GET /api/task/info 200 18.3 ms (0 DB calls) Jetty threads: 4/50 (3 idle, 0 queued) (77 total active threads) Queries in flight: 0
[47fd0656-3b0e-4319-9c8d-323b1739d85f] 2021-03-25T14:30:08-04:00 DEBUG metabase.middleware.log GET /api/task/info 200 11.9 ms (0 DB calls) Jetty threads: 4/50 (3 idle, 0 queued) (77 total active threads) Queries in flight: 0
If you can give me some indicator of where the "Diagnoistic Info" link or tab is, I'll send that as well.
Thanks!
 in upper-right corner > About Metabase - which version are you using?