Hi All,
We are switching to Metabase and I face a very simple problem regarding visualisation.
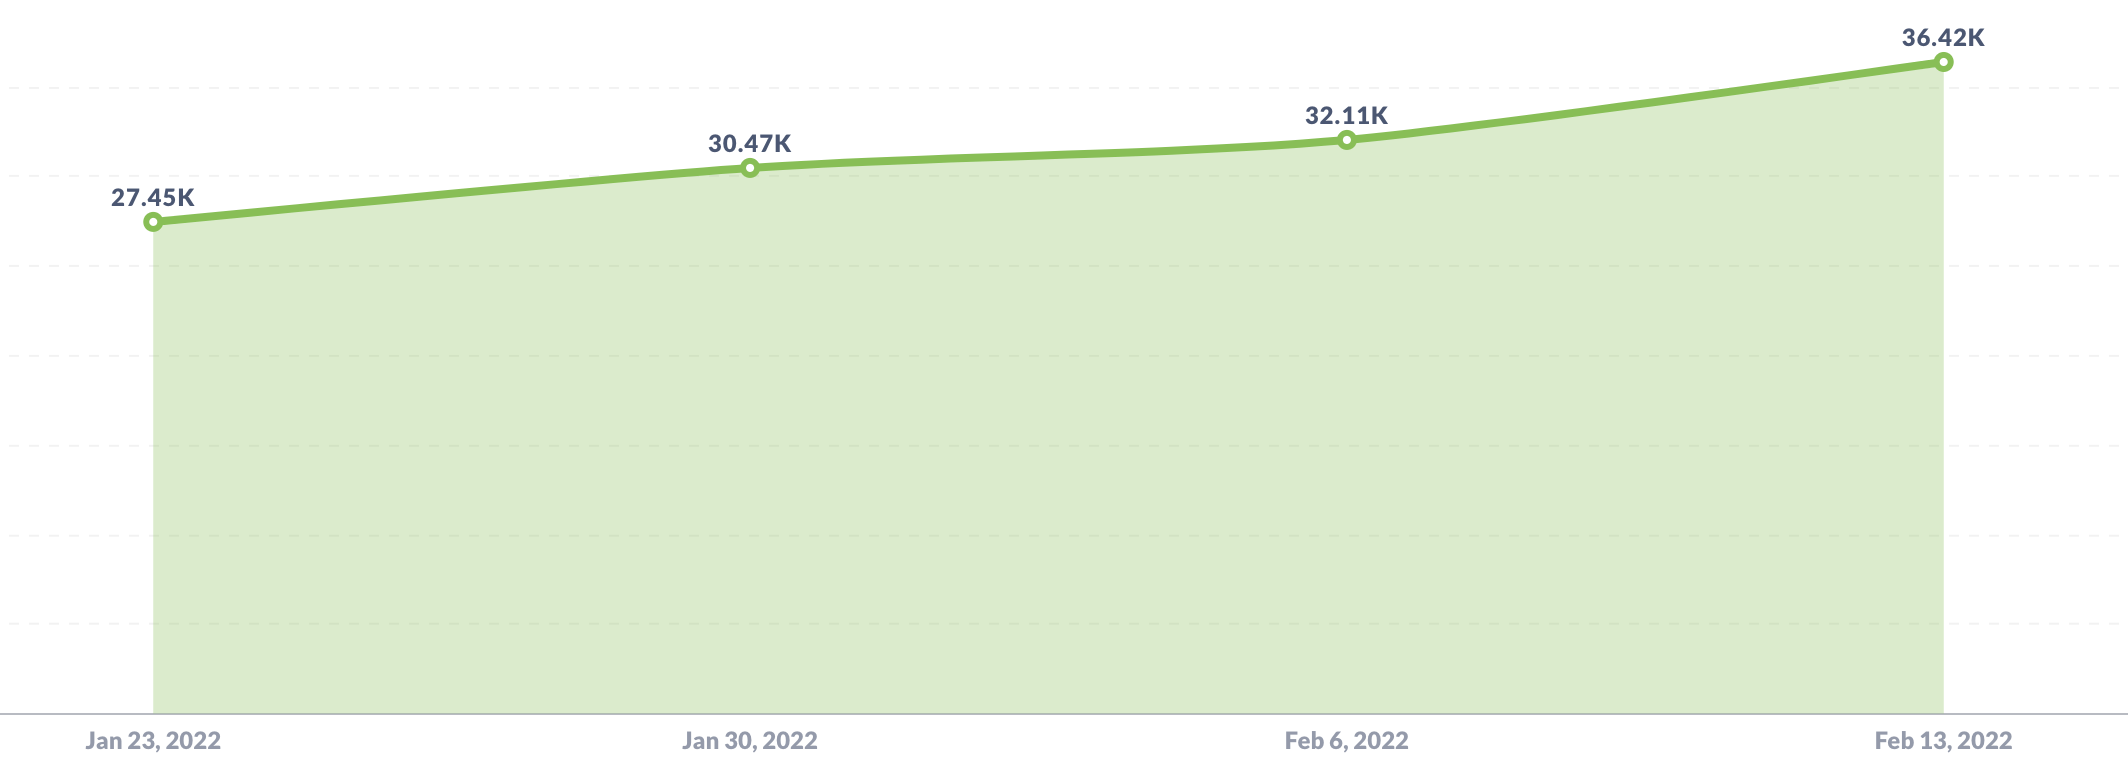
I would like to add to the graph below the % of growth between two weeks (as a line for instance), with a right axis. I read topics here and blog article, but I did not figure how to do it.
Do you have any tips that could help me?
Thanks a lot!
Sven