Hi
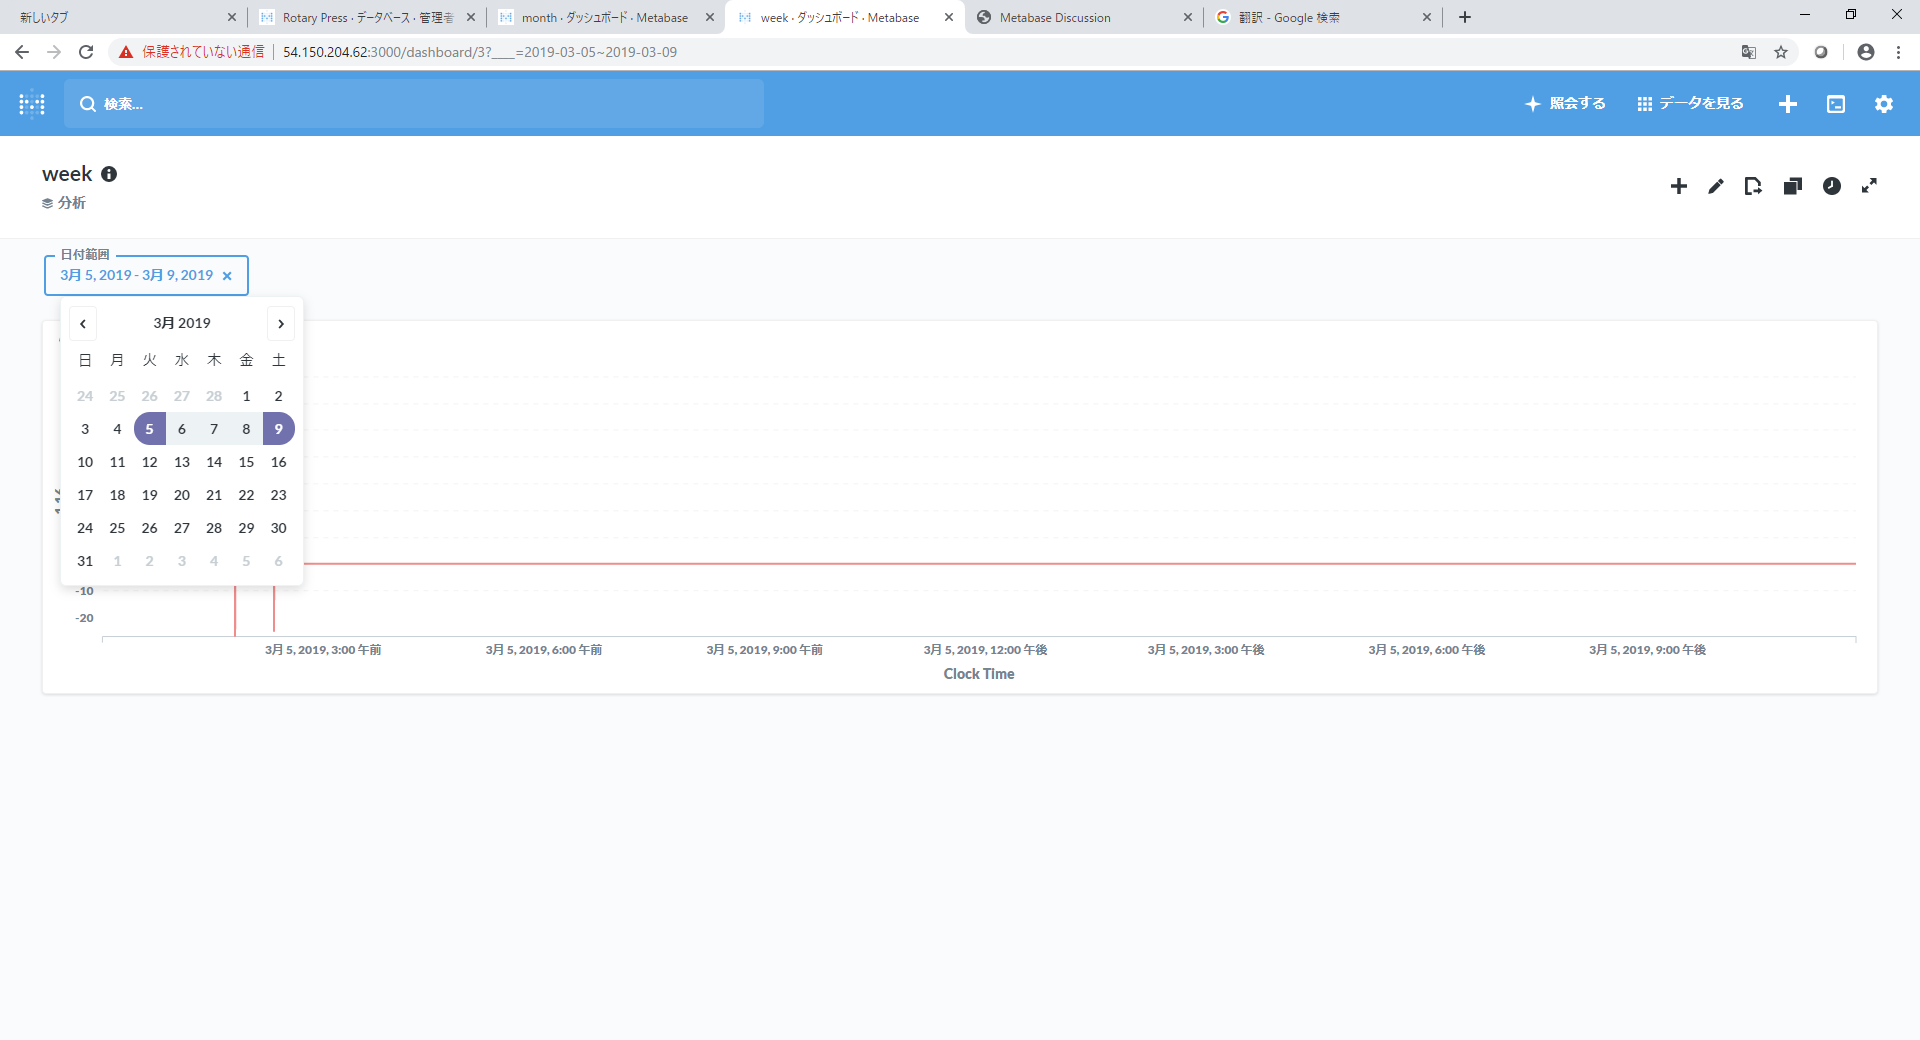
I have selected multiple dates, but only one day is displayed.
Can I see data for multiple dates?
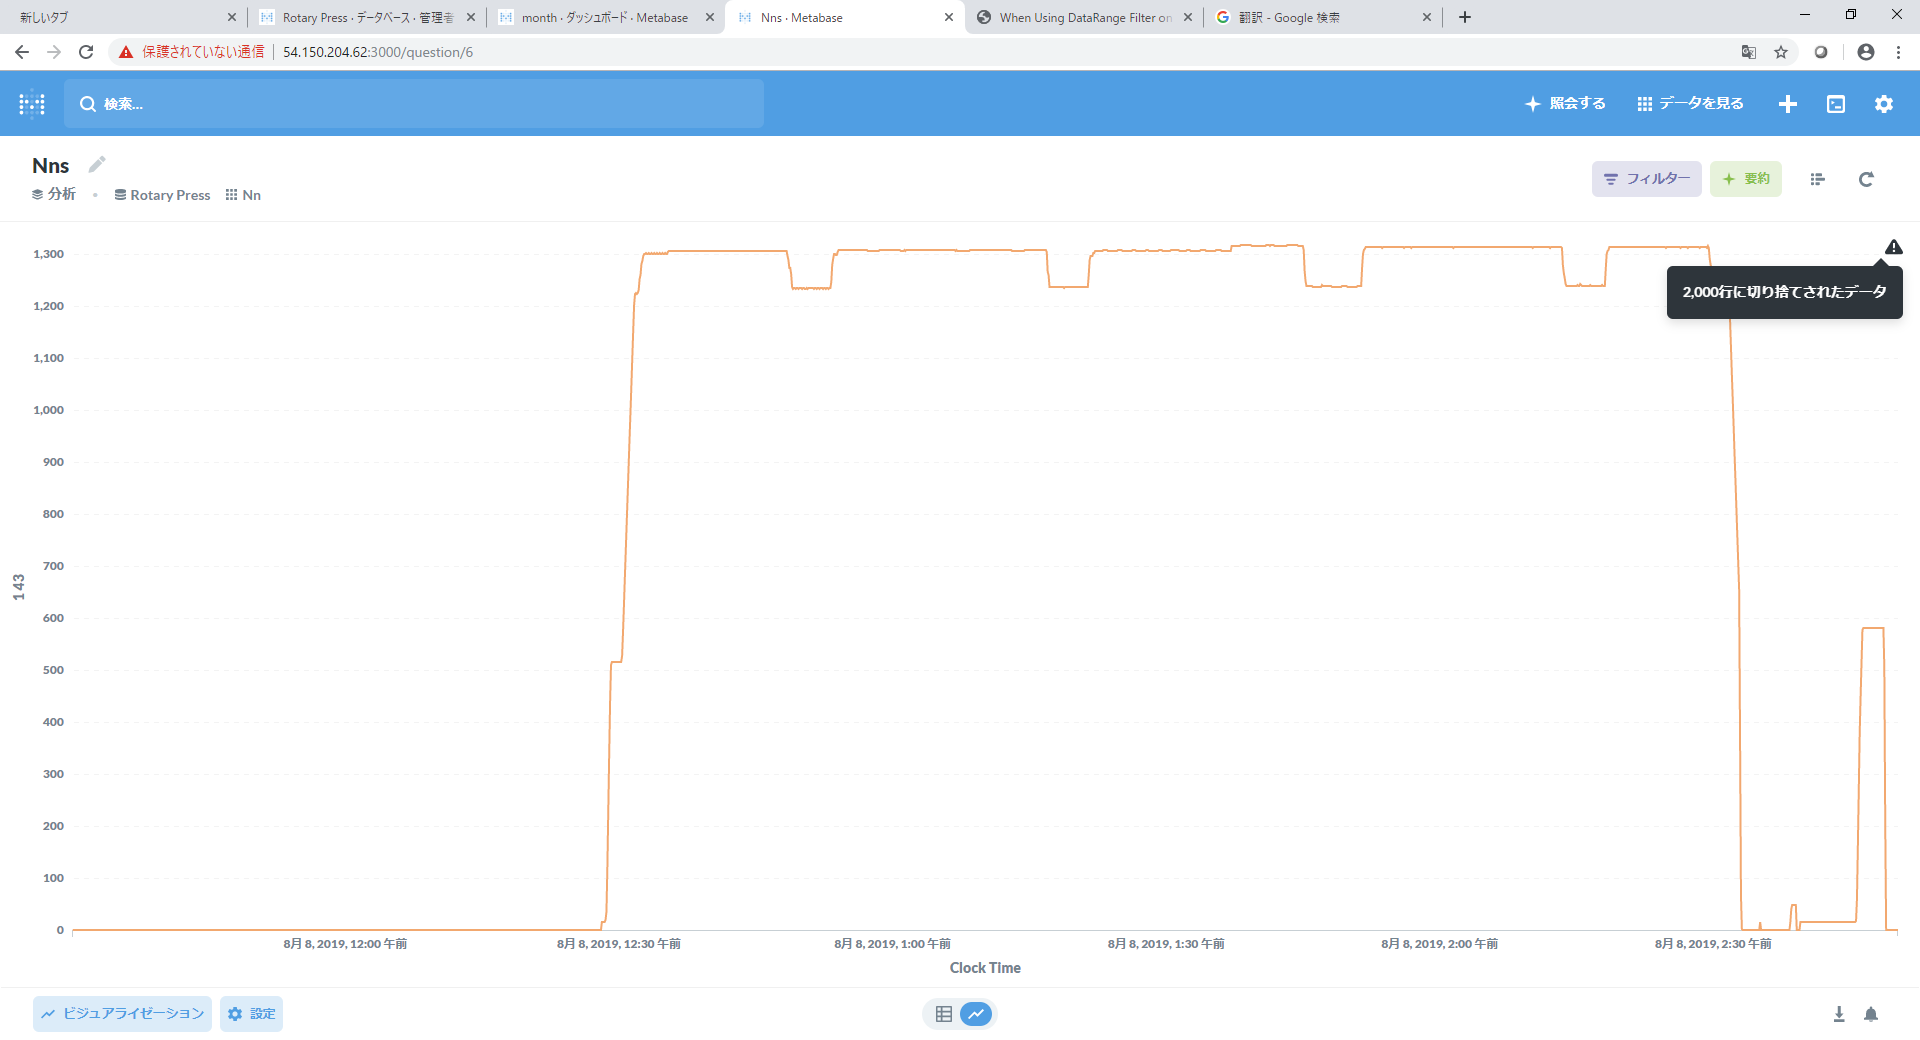
Maybe the 2000 line limit is in the way?
Hi
I have selected multiple dates, but only one day is displayed.
Can I see data for multiple dates?
Maybe the 2000 line limit is in the way?
Hi @yuuuuuuuji
Can you go to the question instead of displaying on a dashboard?
You should see a black triangle in top-right corner of the visualization, which should let you know if you’re hitting the 2k limit.
If you need to show data from multiple days, then you should bin/group by hour or date, so you have fewer points.
Hi @flamber
I can see triangle.
After all, does it mean that you cannot see more than 2000 lines of data on the Dashboard? and need to reduce the number of data in order to see multi-date data?
@yuuuuuuuji
Metabase has a couple of limits.
2,000 rows, when showing unaggregated data
10,000 rows, when showing aggregated data (like if you group by something)
1 million rows, when downloading data as CSV/XLSX/JSON.
Thanks.
For example, can the values of selected items be averaged every 10 rows and aggregated and displayed in a linear graph?
Now, the original CSV data is processed and displayed according to the above rules.
@yuuuuuuuji
So aggregating by a specific number of rows might not be the best for you. Since your data is time-based (histogram), then you want to group by X minutes instead.
It seems like you have data every minute, which would 1440 rows for a day (60*24) - is that correct?
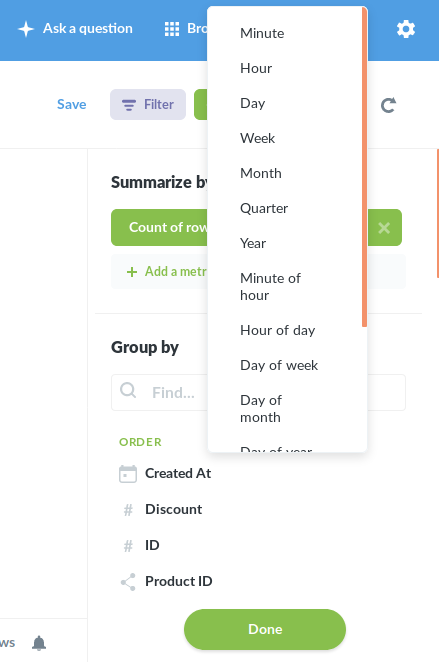
Currently the binning of histograms are either by Minute or Hour. There's no 10 or 15 minutes intervals. You use the Summarize-button, and select the time-column to group by, and set the binning:
If you want/need a different interval (like every 15 minutes), then you need to create a Native query (SQL).
I don't know which database you're querying, but you can do a search like "sql group by 10 minutes":
https://stackoverflow.com/questions/9814930/group-datetime-into-5-15-30-and-60-minute-intervals