0.34.3 version Some problems

I am very happy to be able to use an excellent product such as metabase, but I encountered some problems on the 0.34.3 version.
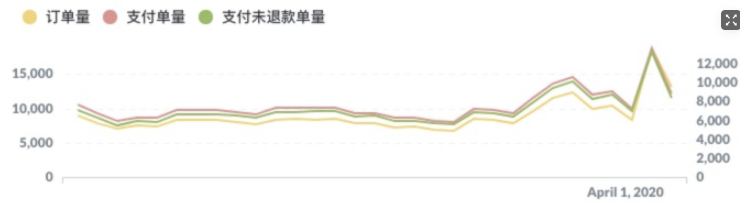
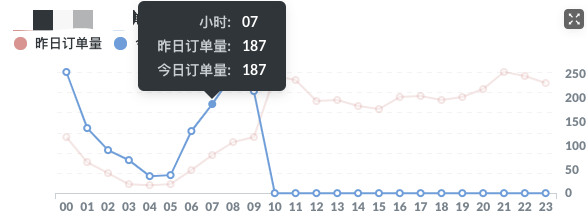
1、 As shown in the figure below, the amount of yellow lines is the highest. He should be at the top of the three curves, but the opposite, He went to the bottom.


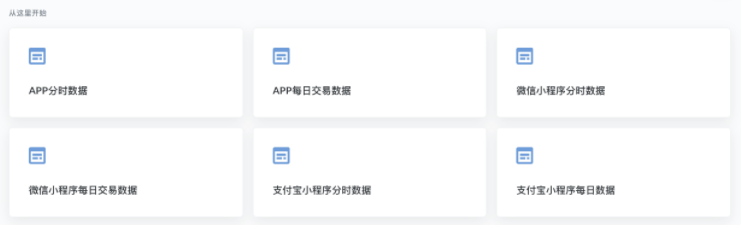
2、The analysis panels are out of order: after adjusting each panel in the analysis list, what I see on the outside is completely different。


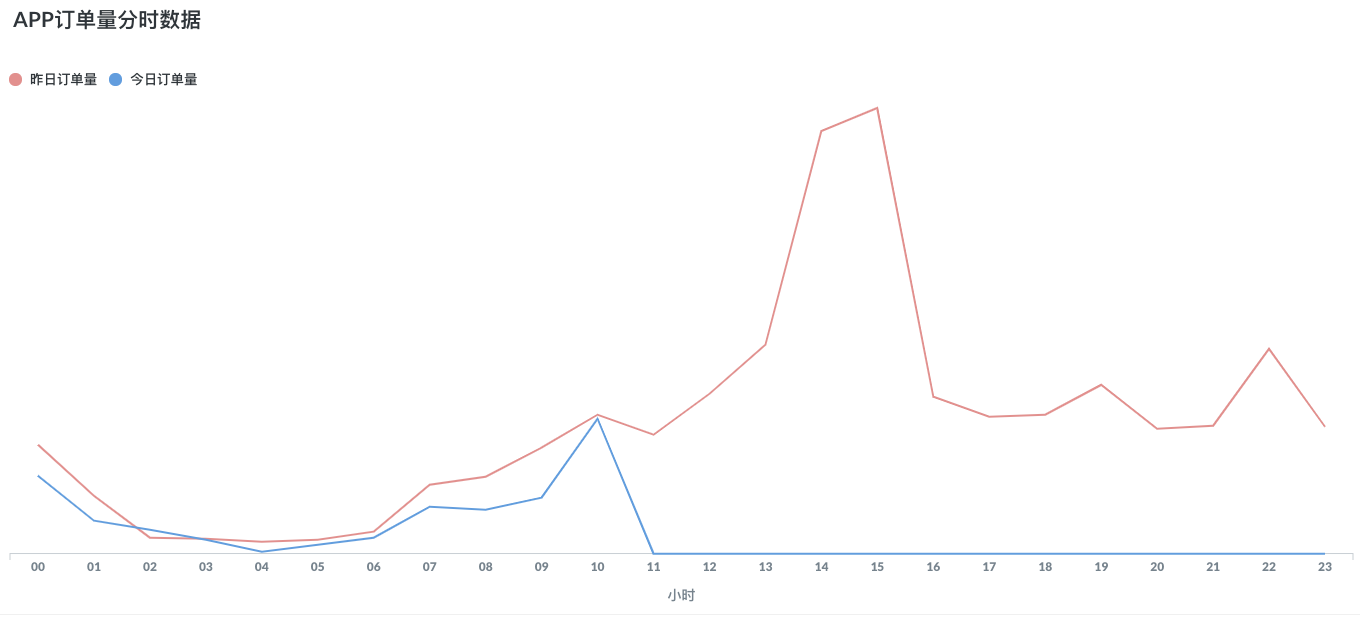
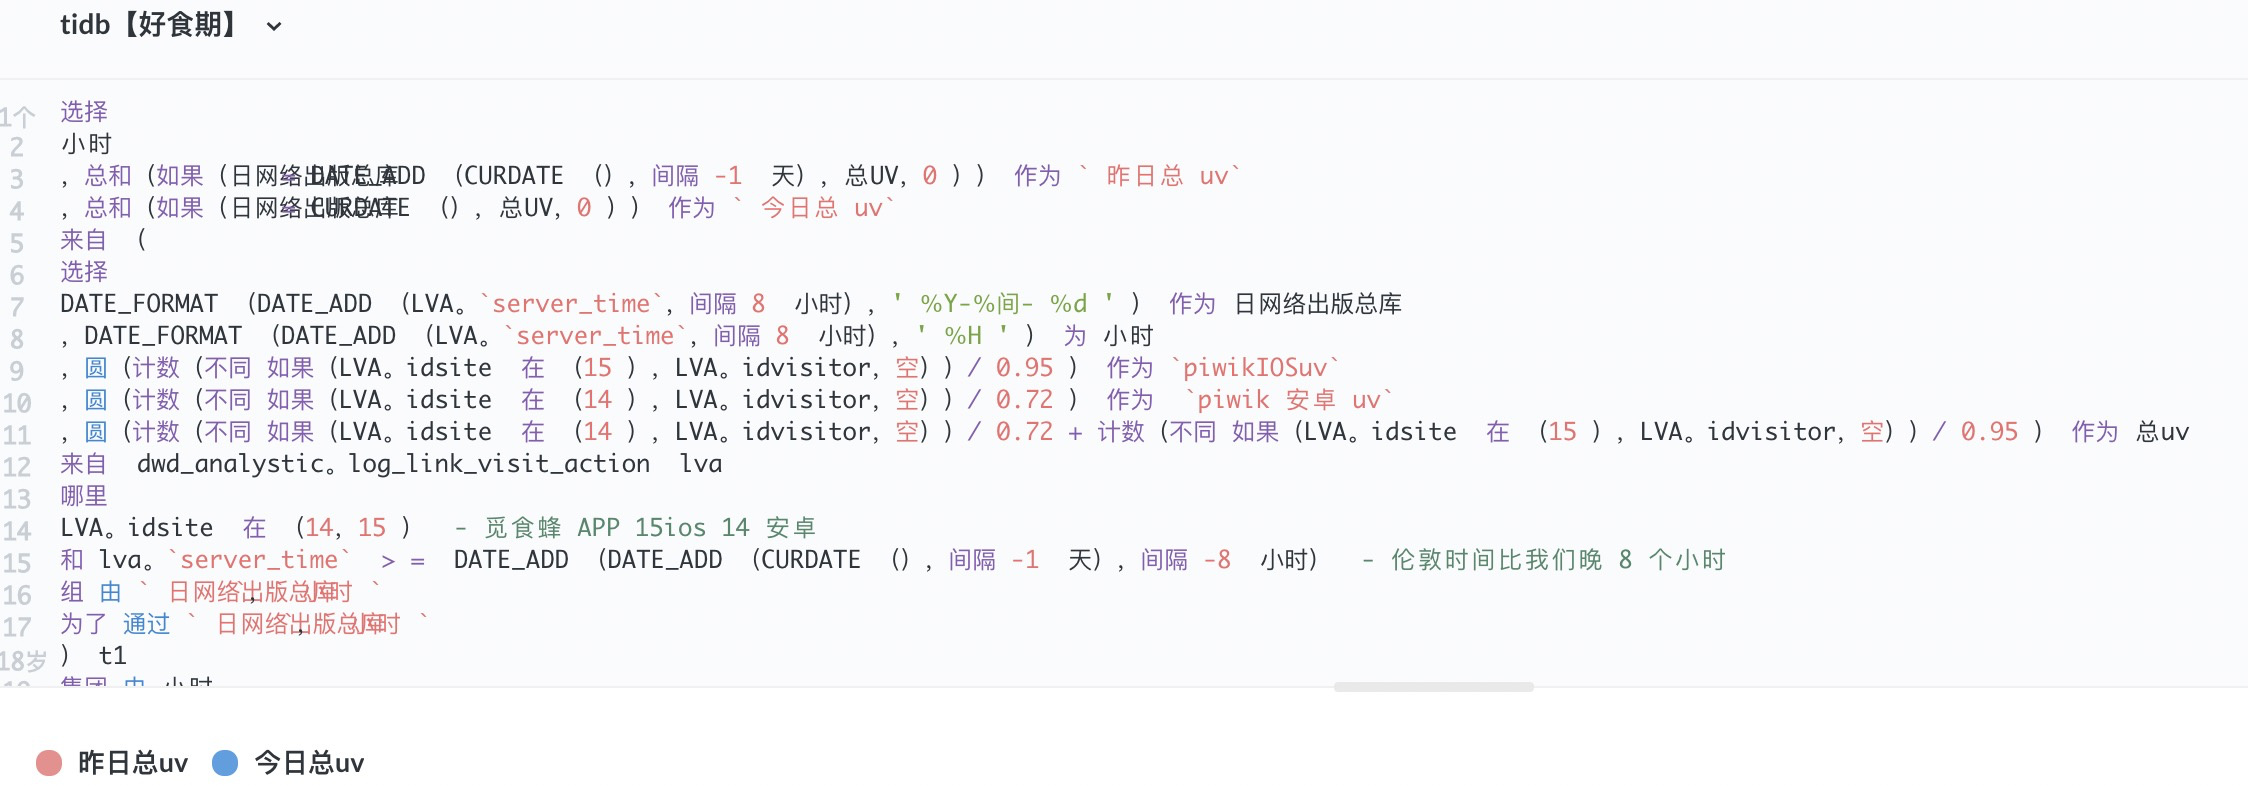
3、The curve and the data do not match
image

My English is not very good, so I do n’t know if you can understand it. But still looking forward to a solution. Thank you.

Hi @yang735136055

Latest version is 0.35.1

  1. That’s likely because you’re using “Use a split y-axis when necessary” - disable that via visualization Settings > Axes.
  2. https://github.com/metabase/metabase/issues/12284 - upvote by clicking :+1: on the first post
  3. Are you sure it’s not the same problem as in 1. with the split y-axis?
1 Like


Glad your answer, successfully answered our question, there is also about sharing, how can sharing show the Y axis

@yang735136055 I don’t understand. Try explaining your problem in a different way.


As shown in the figure above, the sql in our editor appears garbled
Look forward to your answer

Regarding the last question, I expect to have Y-axis data when sharing

@flamber hello

@yang735136055 I don’t understand. Try explaining your problem in a different way.