I noticed a custom column after an aggregation in a question prevents setting a filter on this same question on a dashbaord level, is it a known behaviour?
Whereas when I do not add the custom column, a filter on a dashboard works perfectly fine.
It sounds like when adding a custom column after an aggregation the new base table to add a filter is the result of the aggregation rather than the initial table.
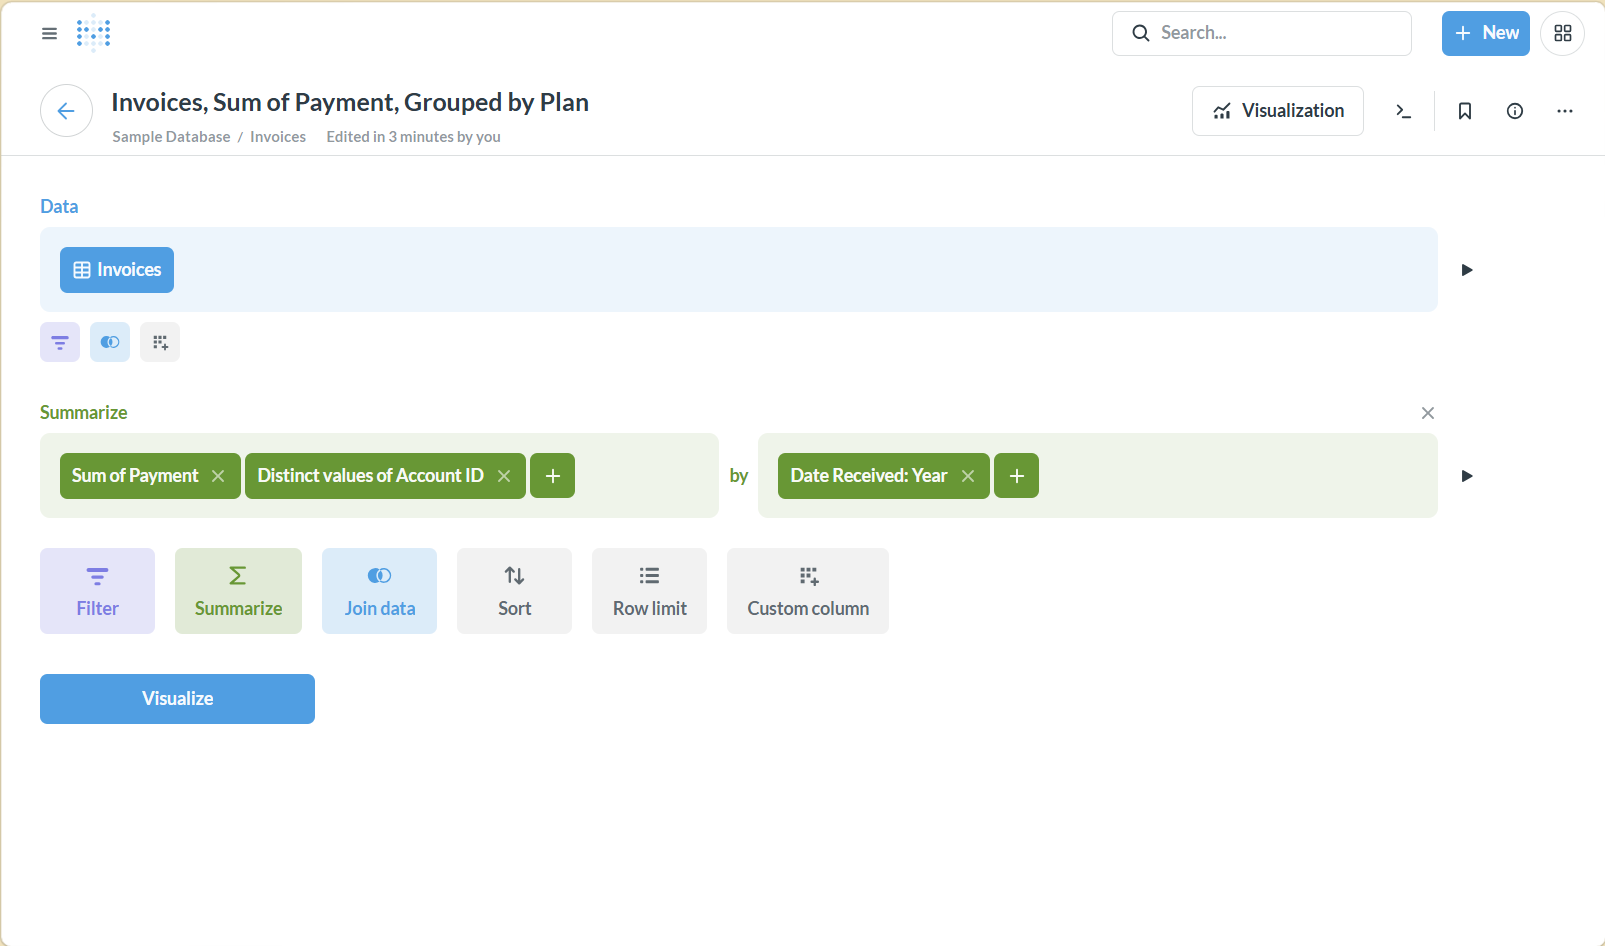
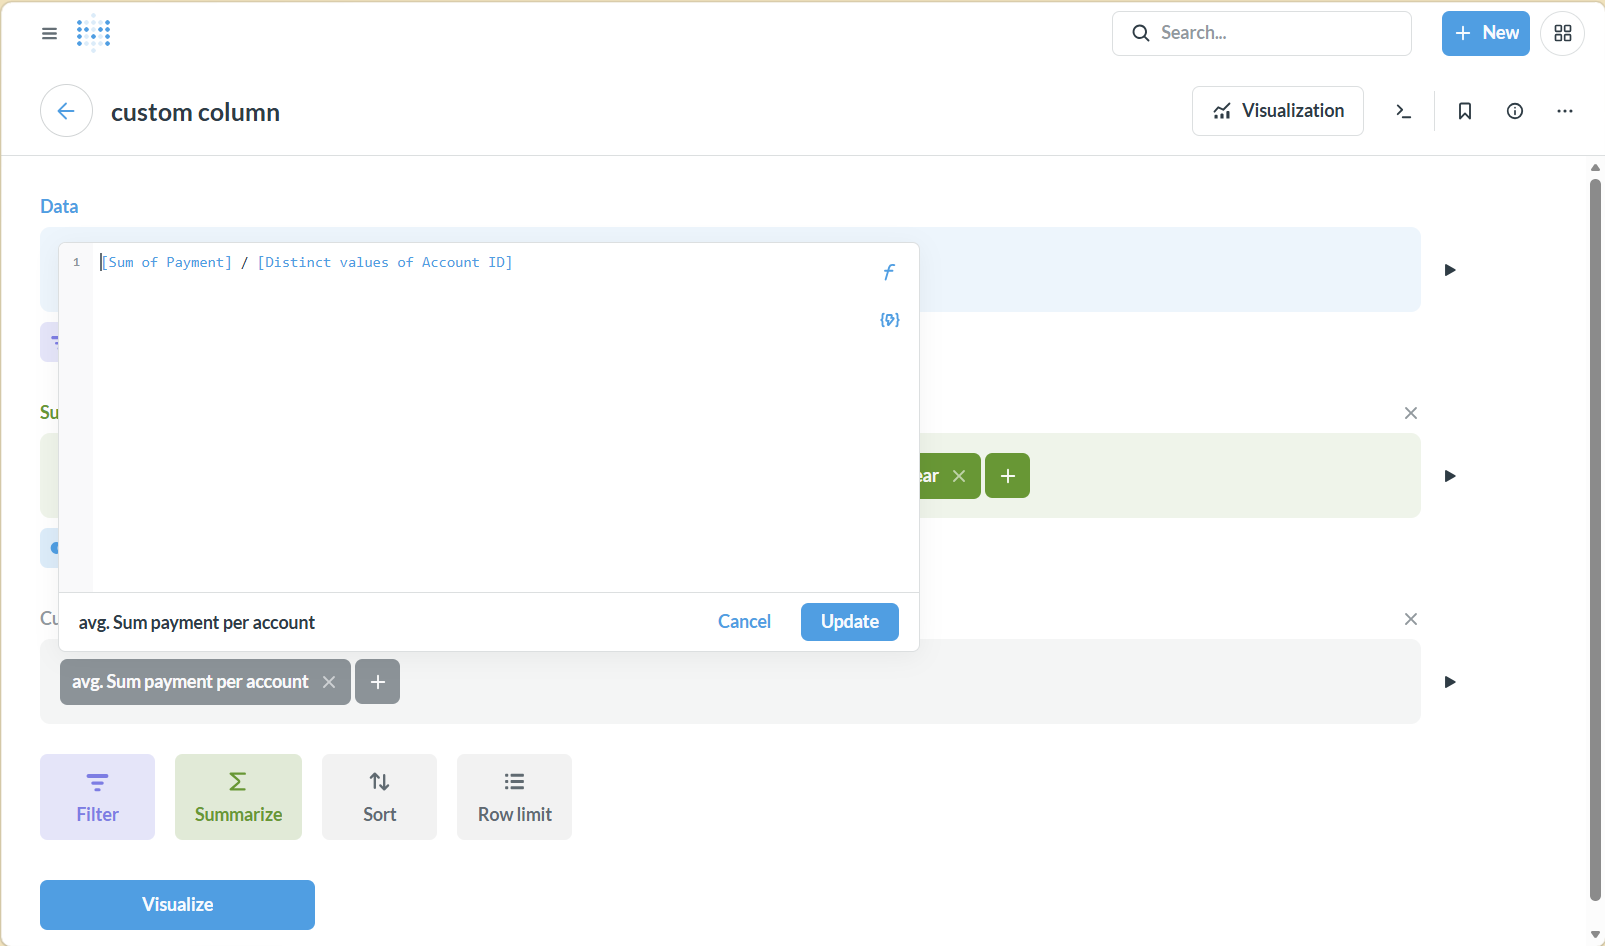
This behaviour is not convenient when we need a column for a sum and a custom column to divide this sum by a scalar to create a ratio.
Metabase Version: 0.43.2
Database : Redshift
Os: macOs Catalina
Browser: Google Chrome Version 106.0.5249.91
Hi @felici1b
There's an issue open about it: https://github.com/metabase/metabase/issues/19744 - upvote by clicking on the first post
Depending on how your structure is, then you might be able to create a Custom Expression in the summarize metric section instead of adding it as a Custom Column.
I struggle about exactly the same behaviour. And don't understand, why Mebabase behaves like this.
To my understanding it is quite inconvenient for all the "Non summative values" like efficiency calculation etc. Especially when the basis are time series data.
I checked the issue 19744 in Github and see as closed. Does anyone know the background? In the current Metabase i don't see how the initial described issue is solved.
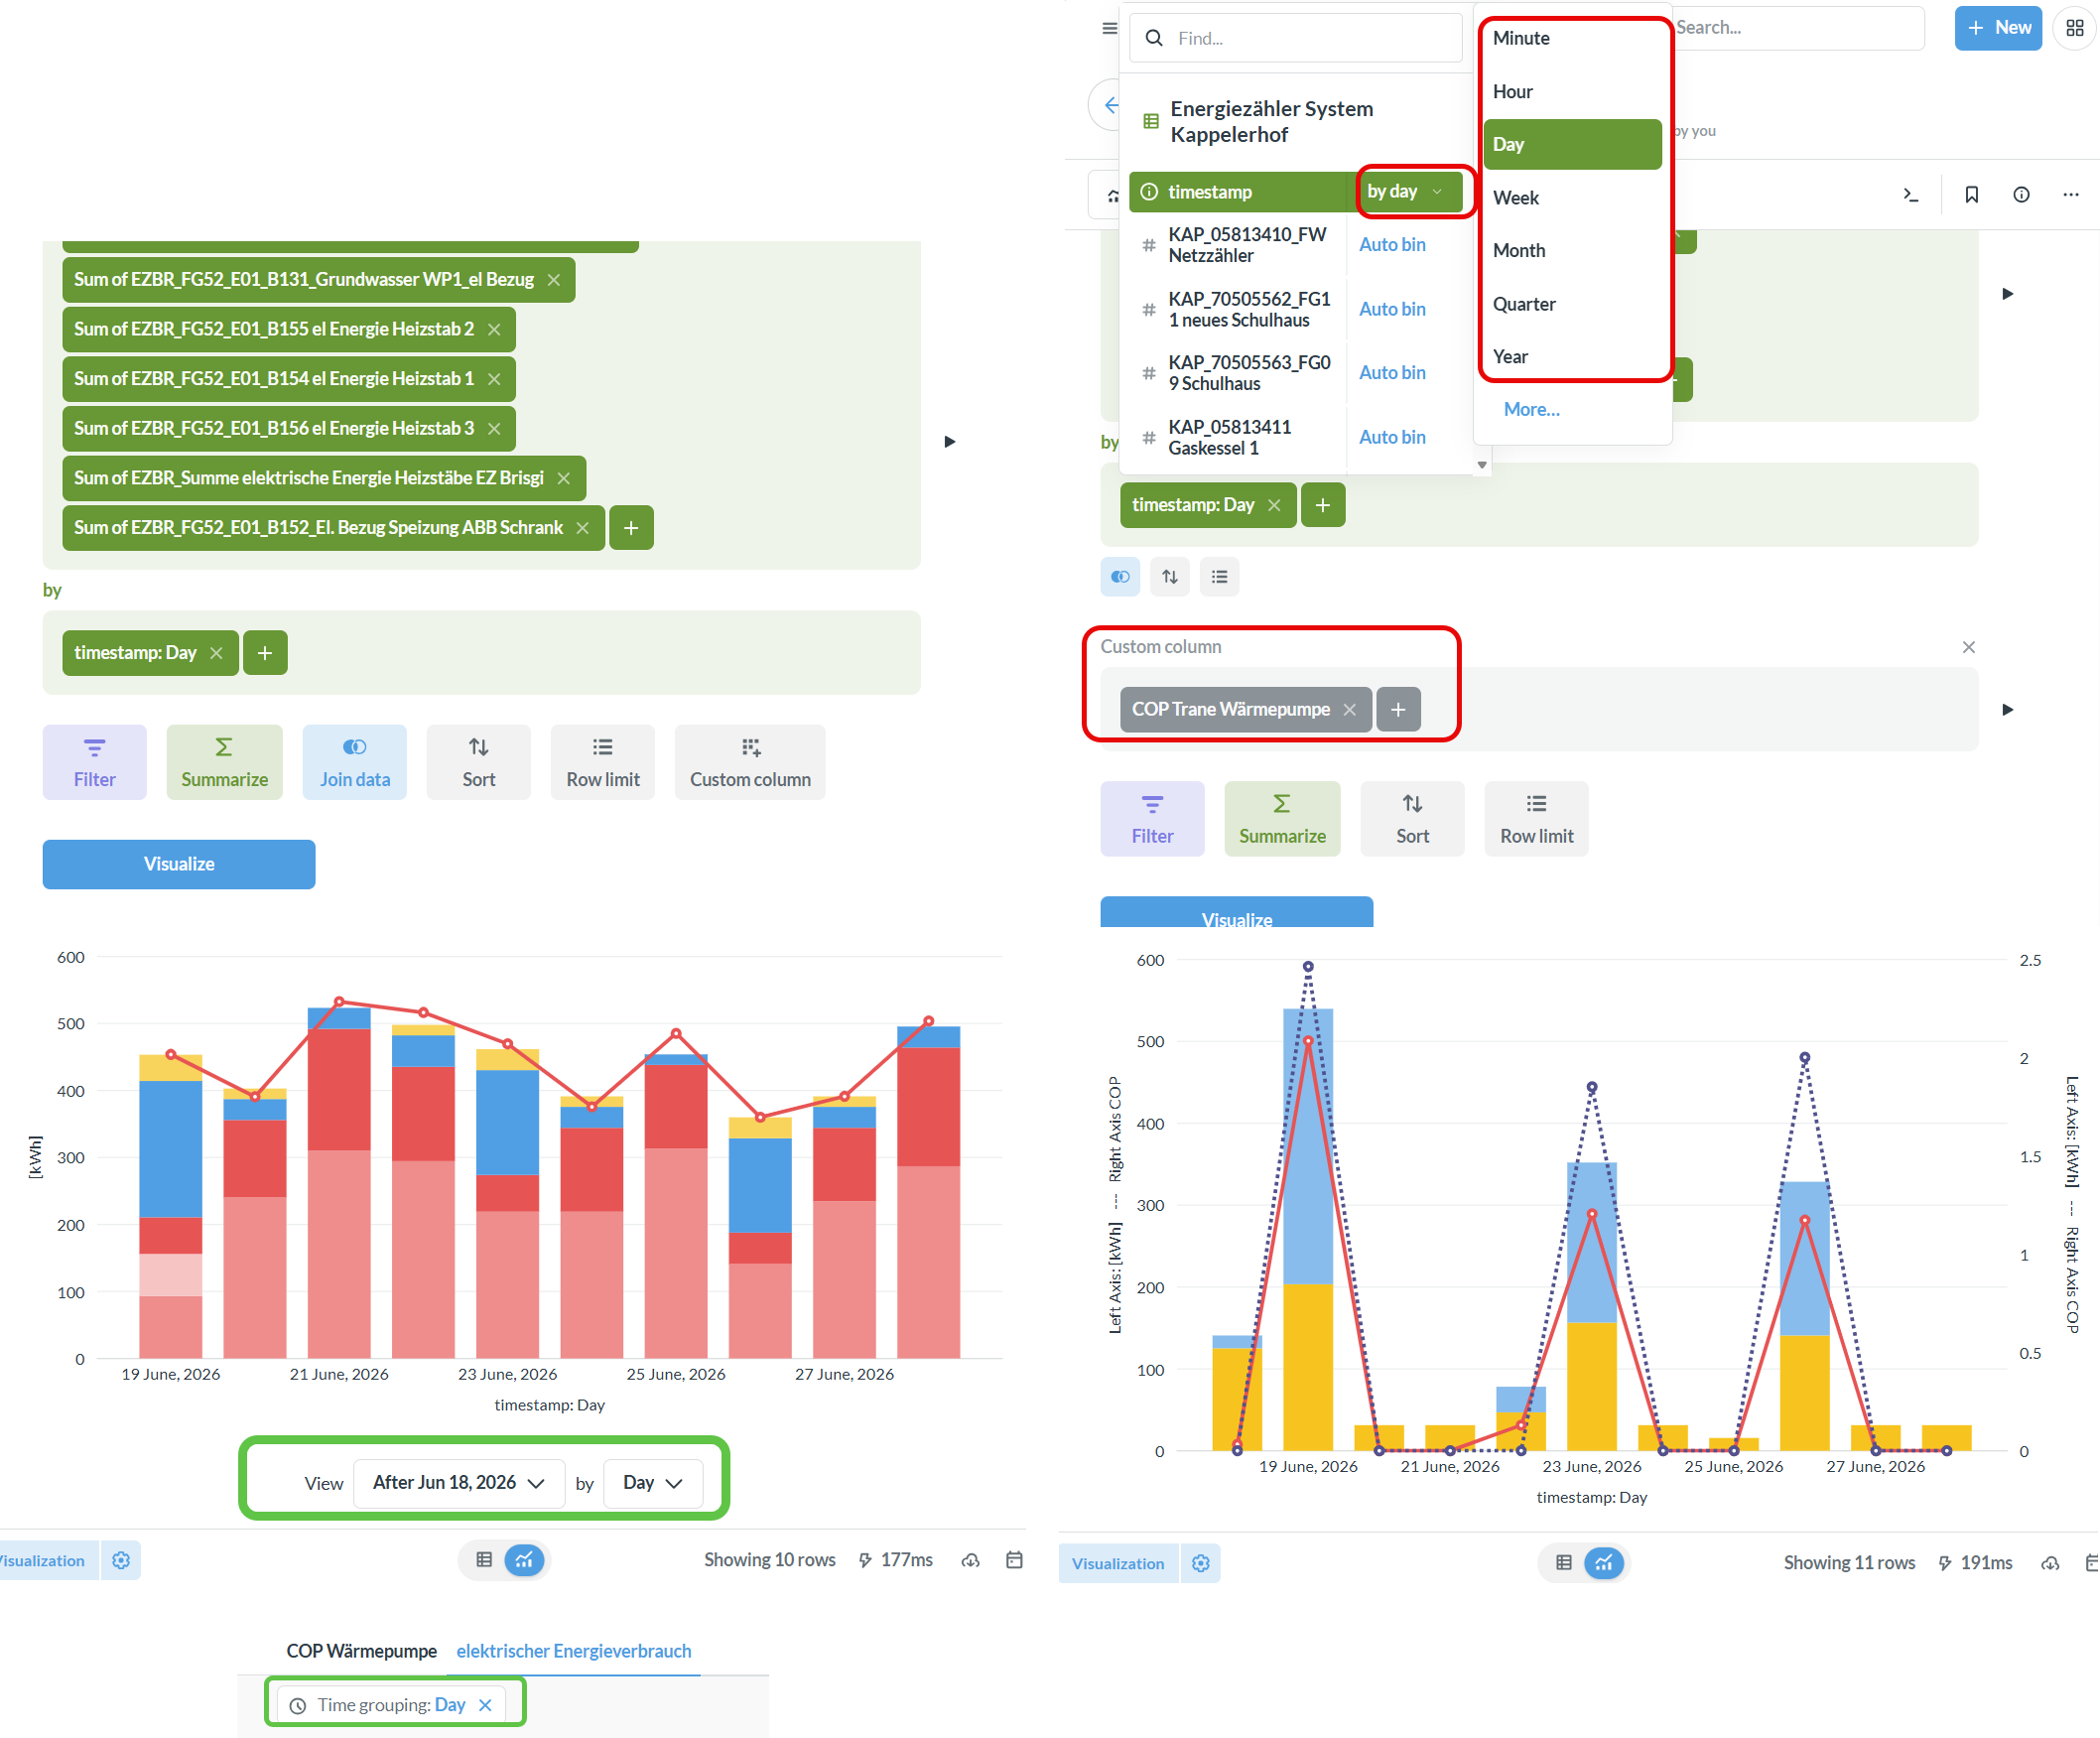
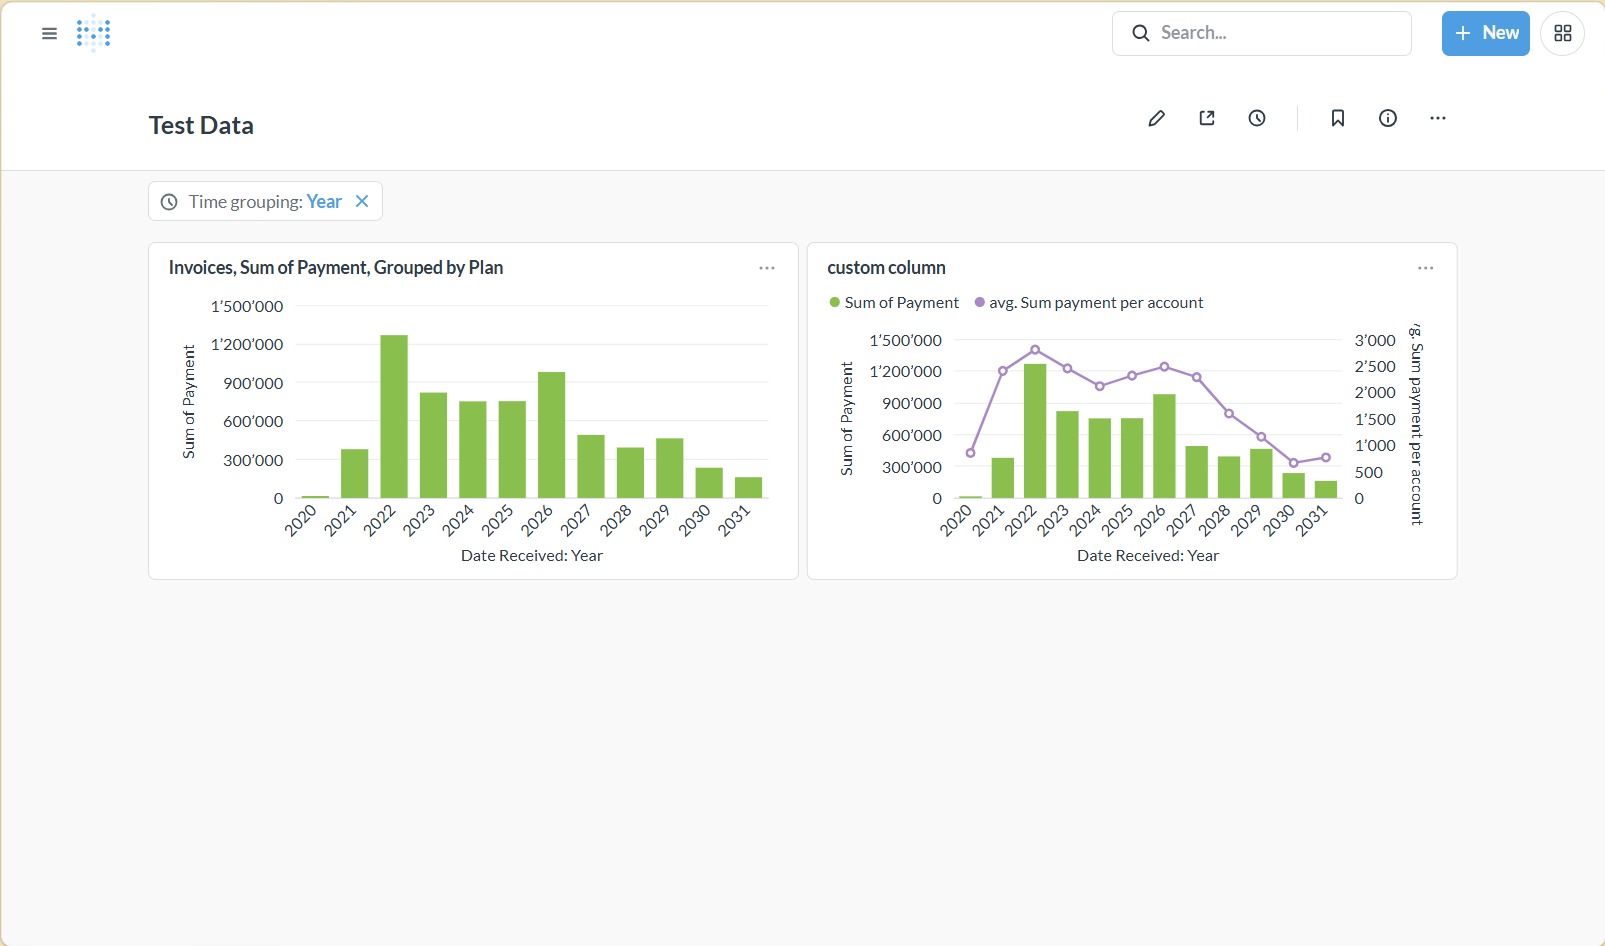
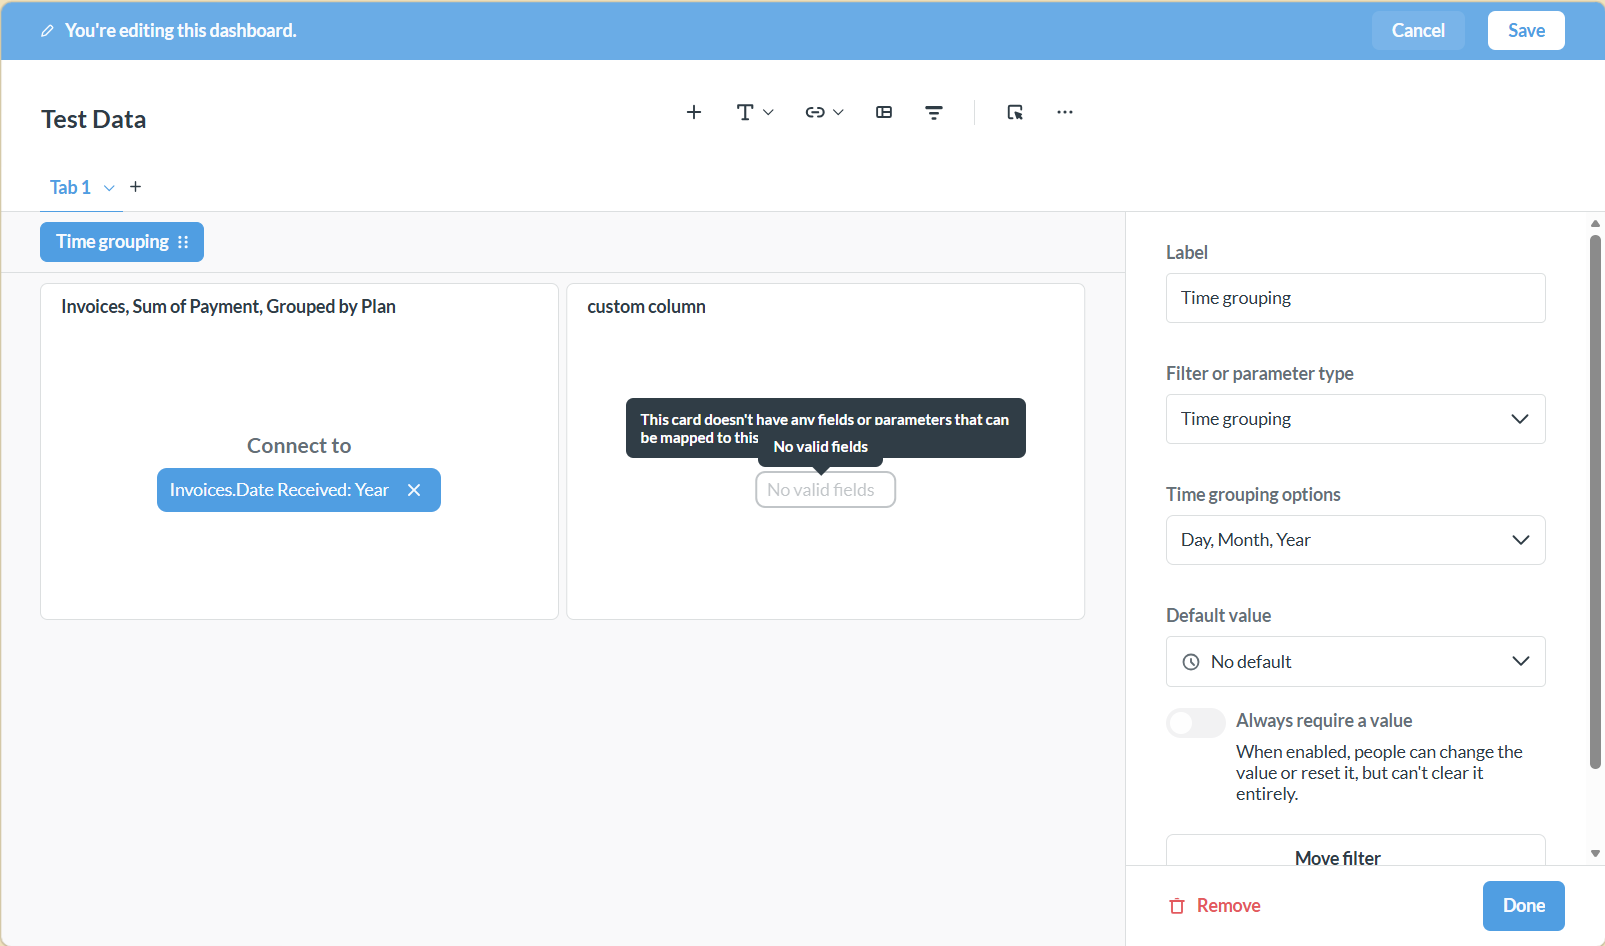
As well see the following use case. On the left side the time series data can nicely be grouped and filtered in the chart (and as well in the dashboard filter). As soon as I add the custom column after the aggregation (required because of the non summative values) the Filter possibilities disappear.
--> i always have to go to the editor, and there i can modify the time grouping...
That’s a question display, though, not a dashboard.
The original post mentioned not being able to attach filters to dashboard questions in a certain configuration, which was addressed in the linked GitHub issue (thus why it was closed).
Its probably related to the UI no longer detecting a filterable timestamp on the bottom stage.
Throw the question on a dashboard, connect a date range and aggregation filter to it, and I bet it works.
--> as a second chart (I placed on the right) add a custom column after aggregation (as described, required for all non summative stuff like efficiency etc.)