lenni
July 3, 2026, 7:11am
1
The use case is specially relevant for all the "Non summative values" like efficiency calculation etc. Especially when the basis are time series data.
Git hub issue:
opened 03:44PM - 18 Jan 22 UTC
closed 10:49PM - 22 Nov 24 UTC
Type:Bug
Type:UX
Priority:P1
Reporting/Dashboards
Querying/Parameters & Variables
.Completeness
Difficulty:Hard
.Frontend
.Backend
.Reproduced
.Wanted: MLv2
**Describe the bug**
When adding a Custom Column after aggregation, then dashbo… ard filters cannot be connected to fields before the aggregation.
Close P1, since it makes creating more complex questions difficult to use with dashboard filters.
**To Reproduce**
1. Custom question > Sample Dataset > Products
2. Summarize Count, Sum of Price, Sum of Rating - grouped by Category - add Custom Column `1 + 1`
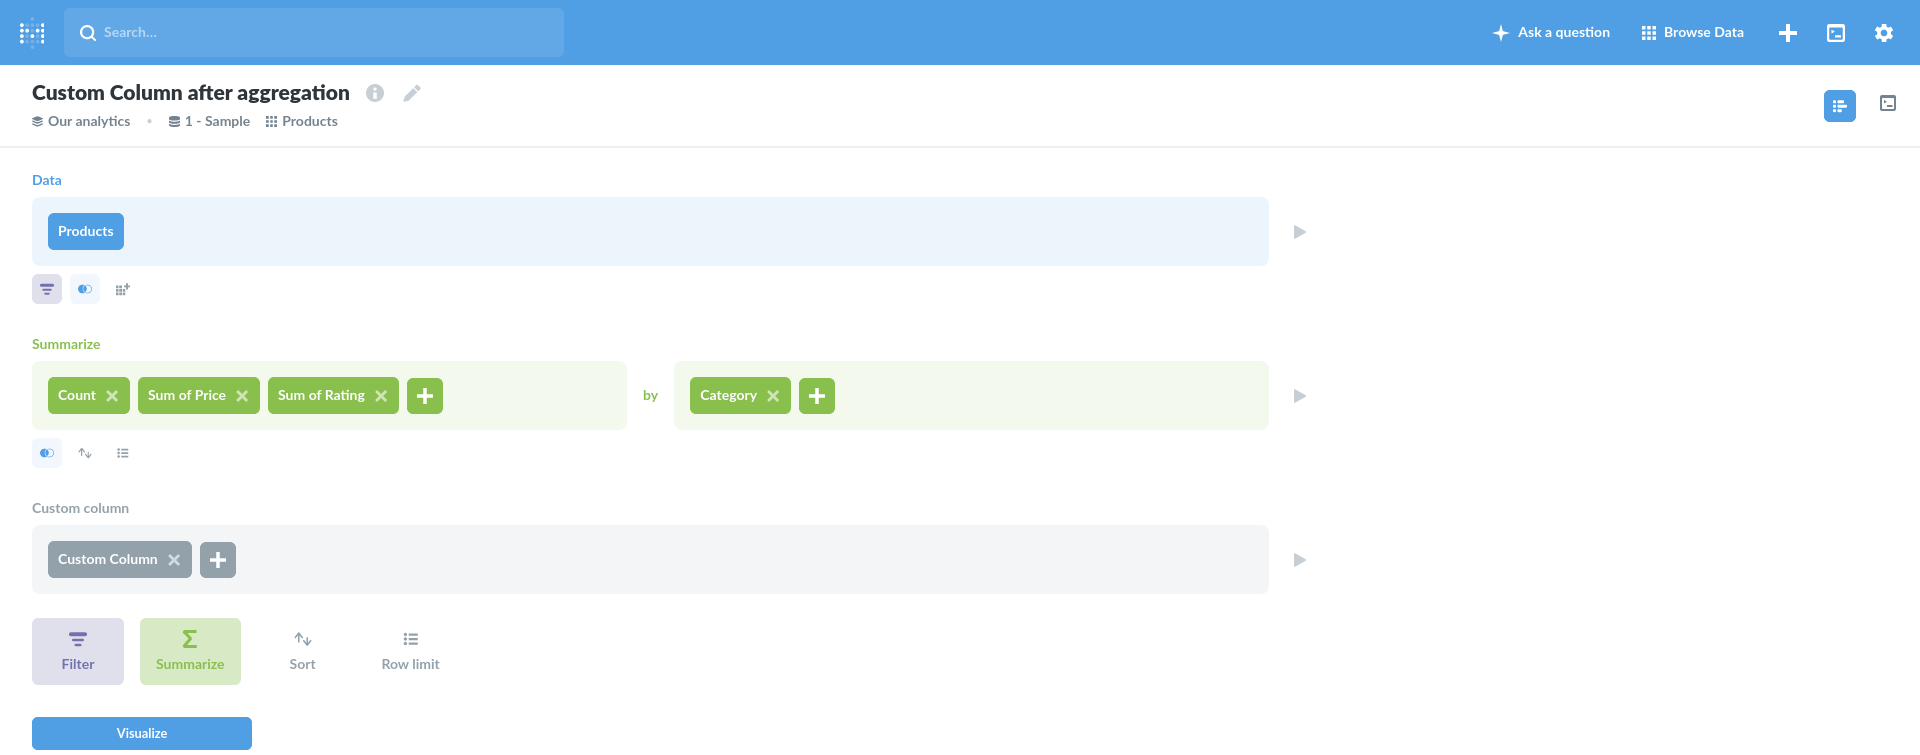
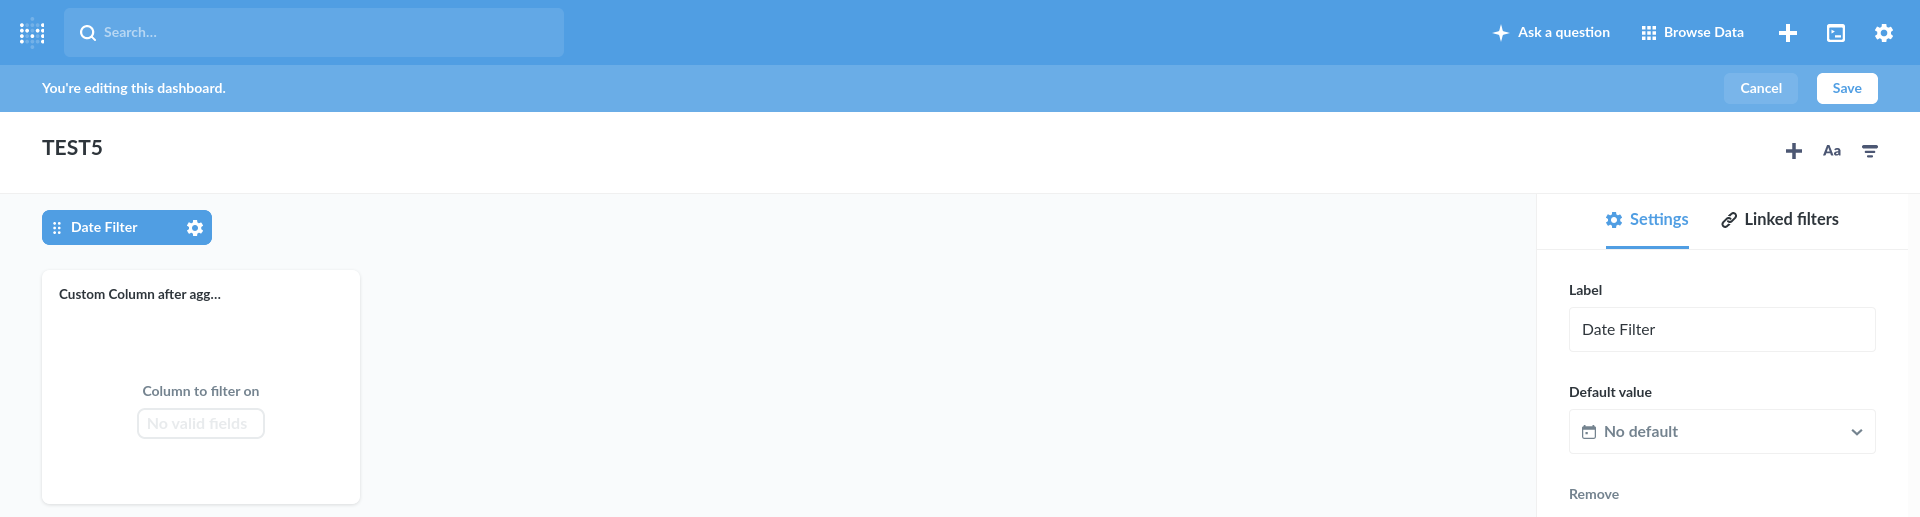
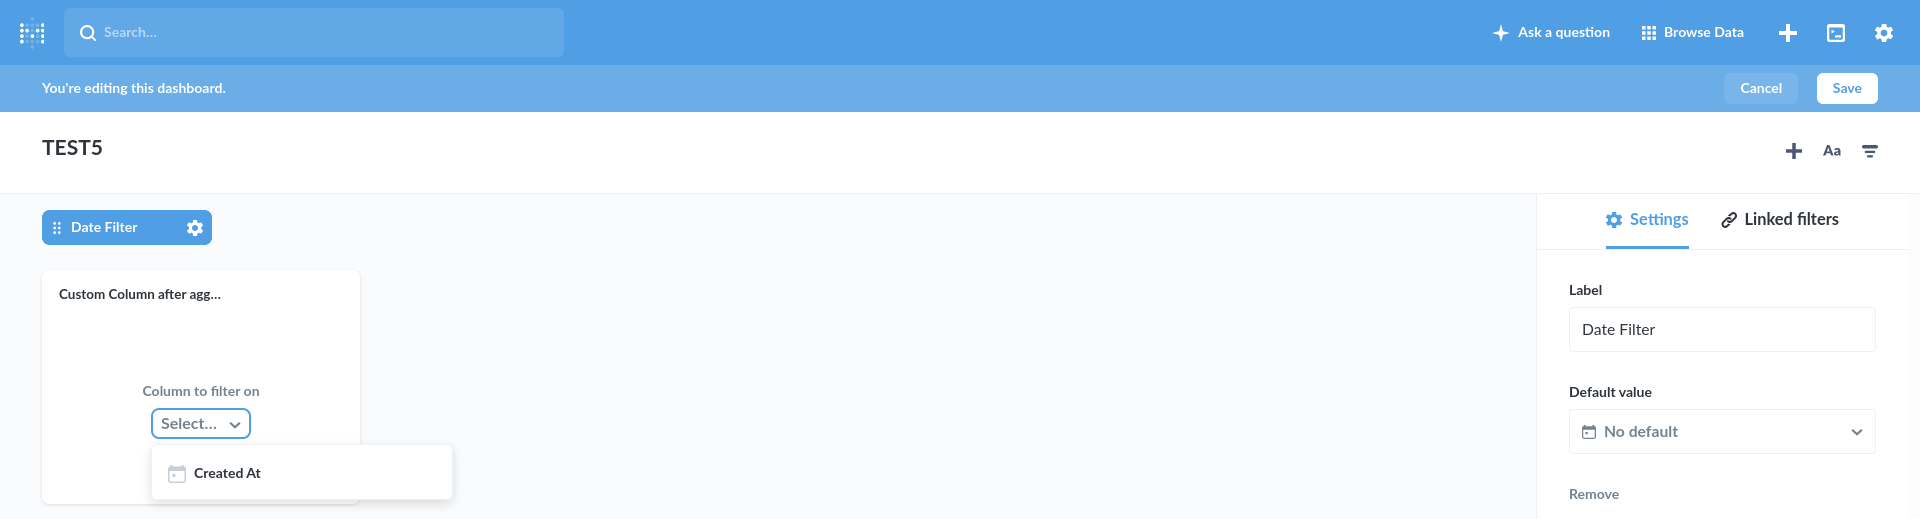
3. Add to dashboard, add Time filter and try to connect to card - it will say `No valid fields` on the card.
**Expected behavior**
Even when added a Custom Column after the aggregation, then I should still be able to filter with fields from before the aggregation.
**Information about your Metabase Installation:**
Tested 0.37.8 thru 0.41.6
**Additional context**
Creating a separate issue, so it doesn't get overlooked when fixing #12985, which is likely the underlying root causes.
:arrow_down: Please click the :+1: reaction instead of leaving a `+1` or `update?` comment
was dealing with this and closed quite some time ago. But did obviously not solve it.
Reconstruction with the sample data:
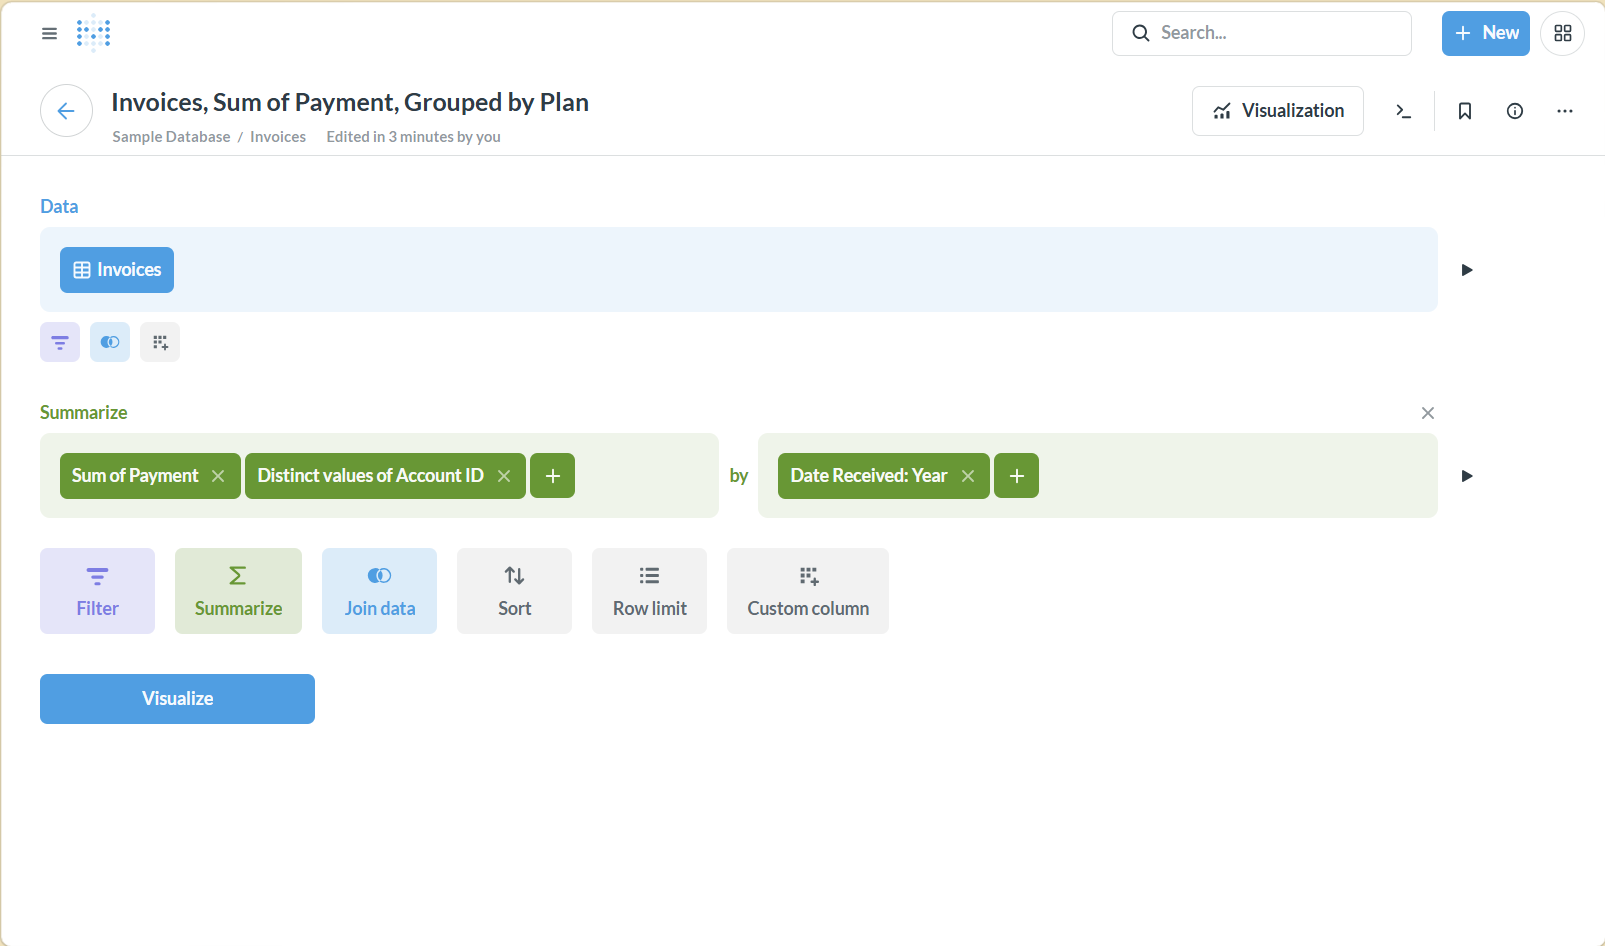
--> first question with simple aggregation by date
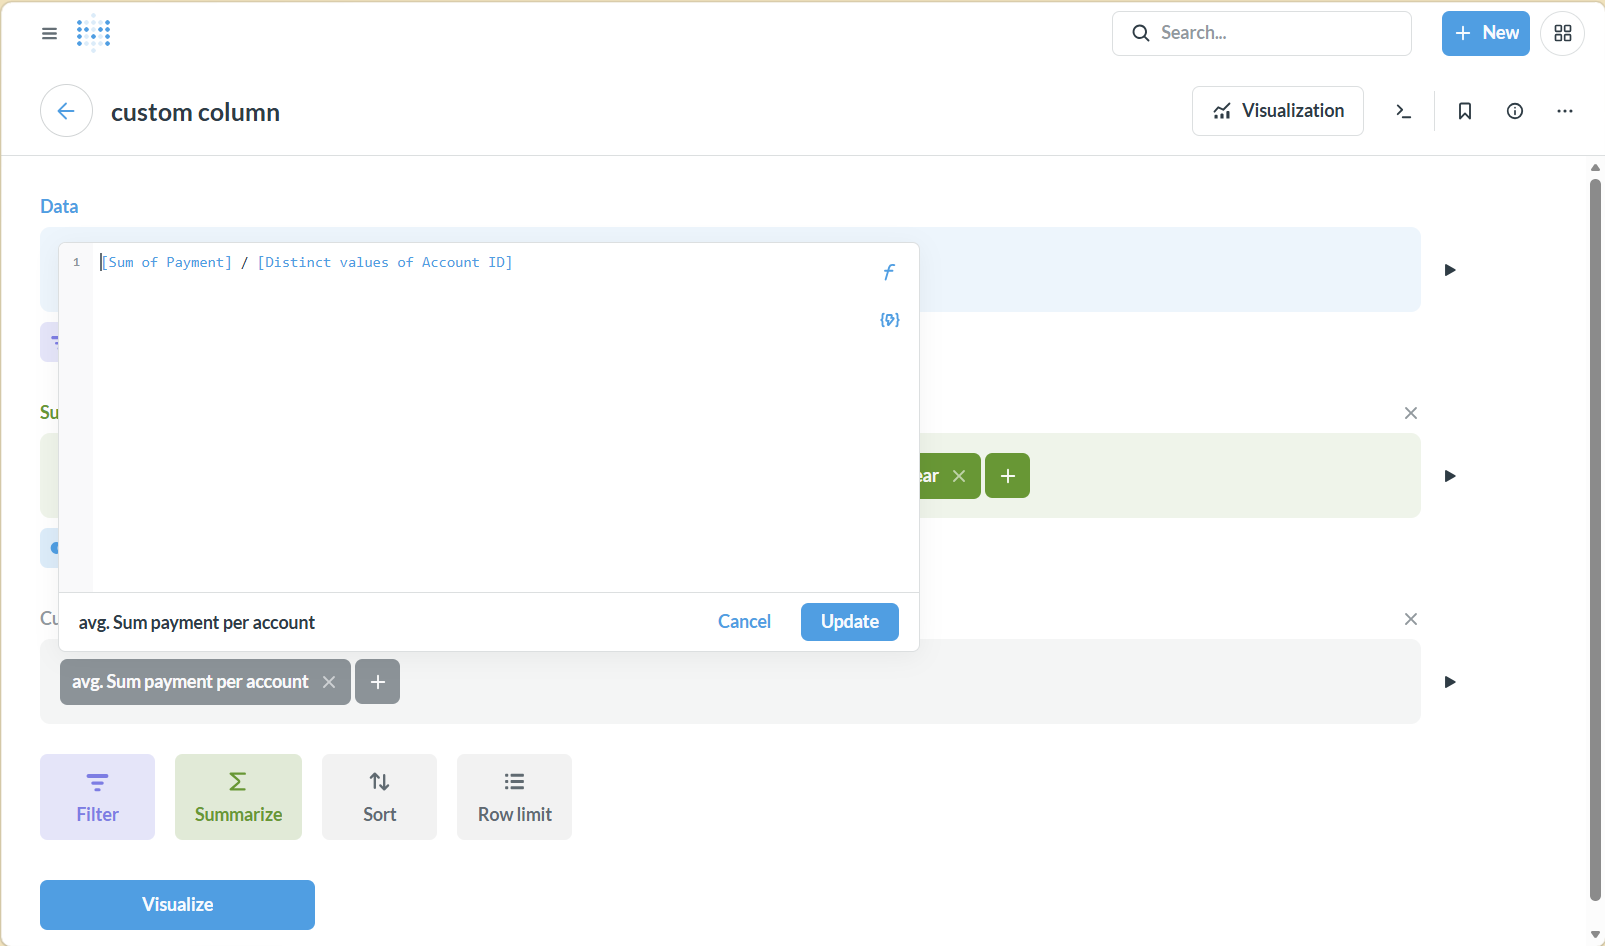
--> as a second chart (I placed on the right - basis is the previous question) add a custom column after aggregation (as described, required for all non summative stuff like efficiency etc.)
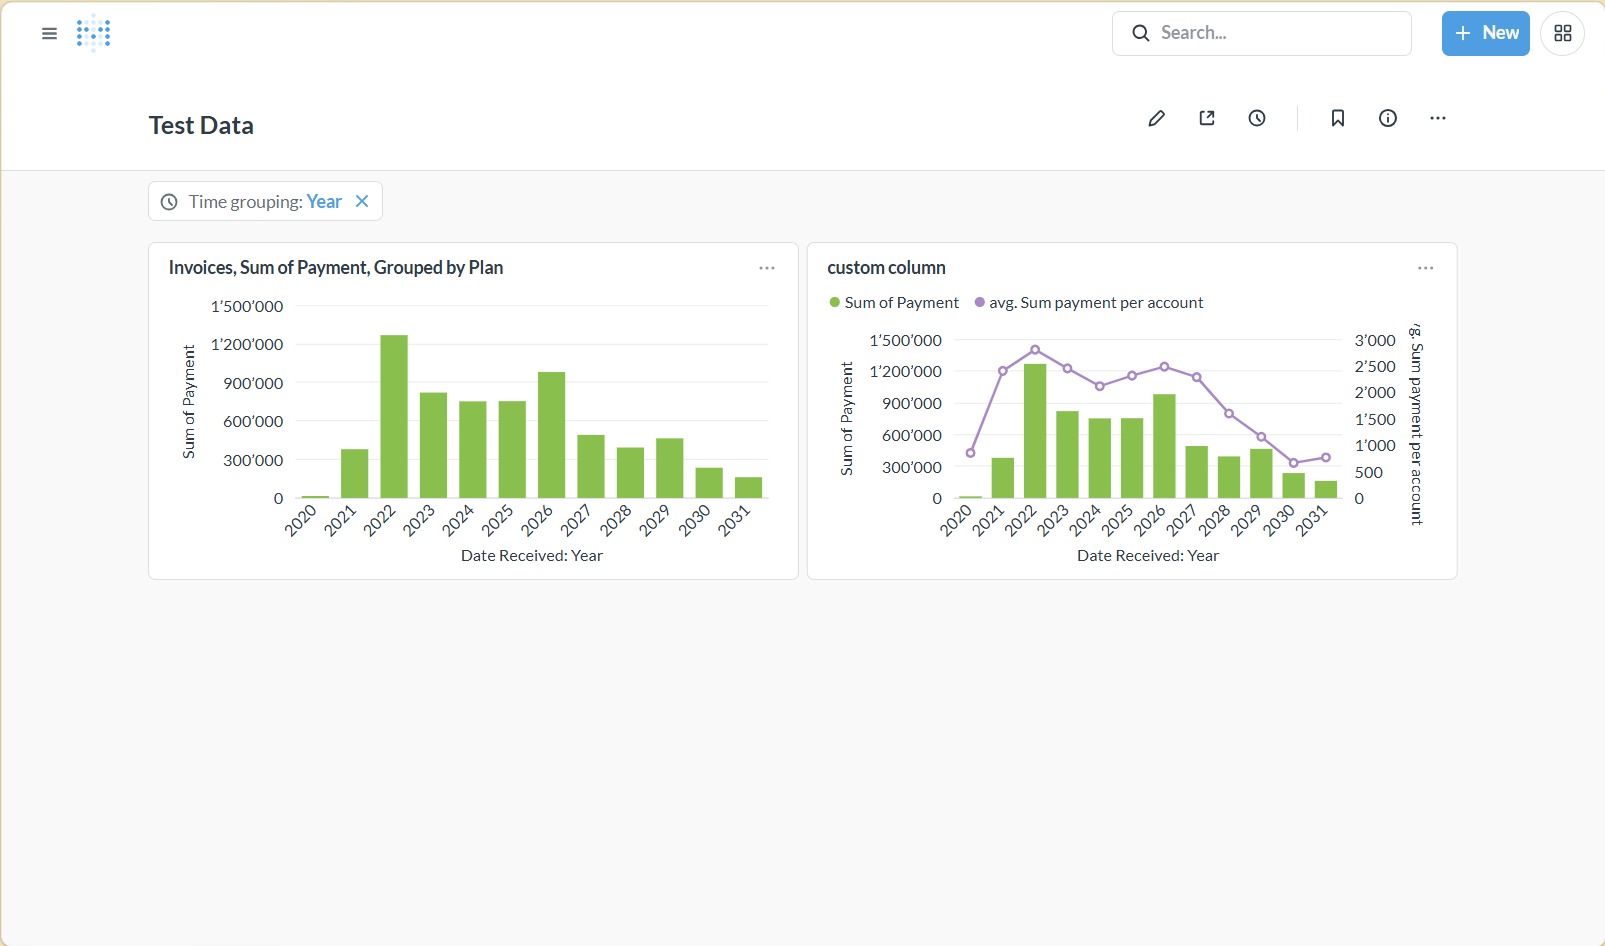
--> Result on the dashboard looks like this - but only the left chart (without the custom column) can be linked to the time grouping filter
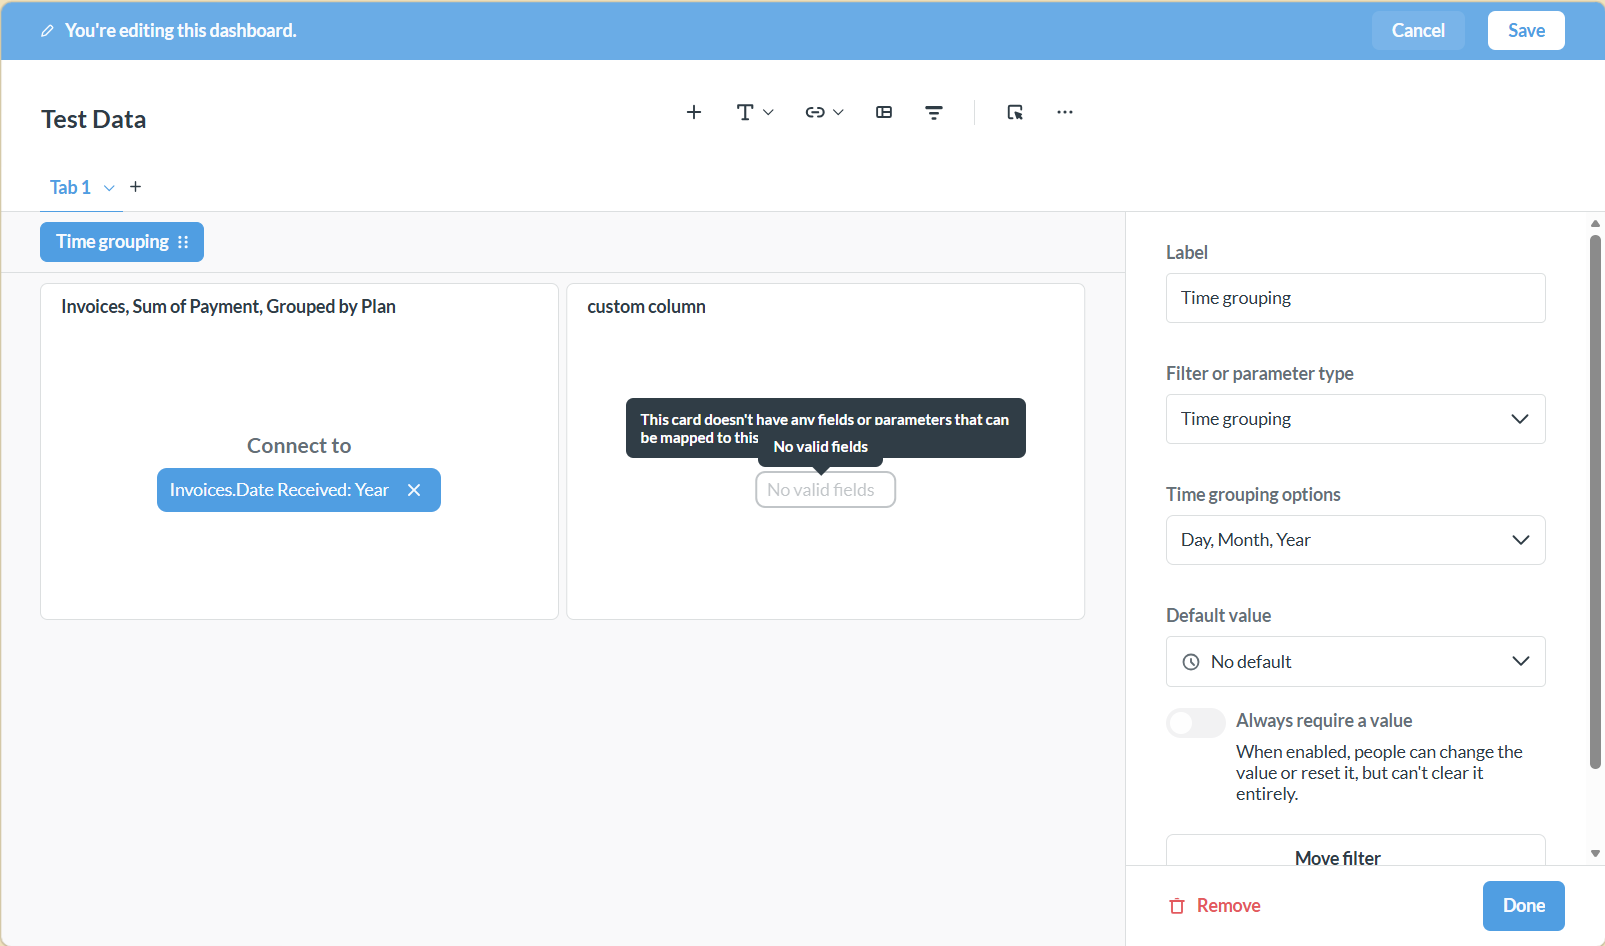
trying to link gives the Metabase message: "This card doesn't have any filds or parameters that can be mapped to this ..."