Hi there,
I have a multi-series line plot, is there a way to achieve the following feature?
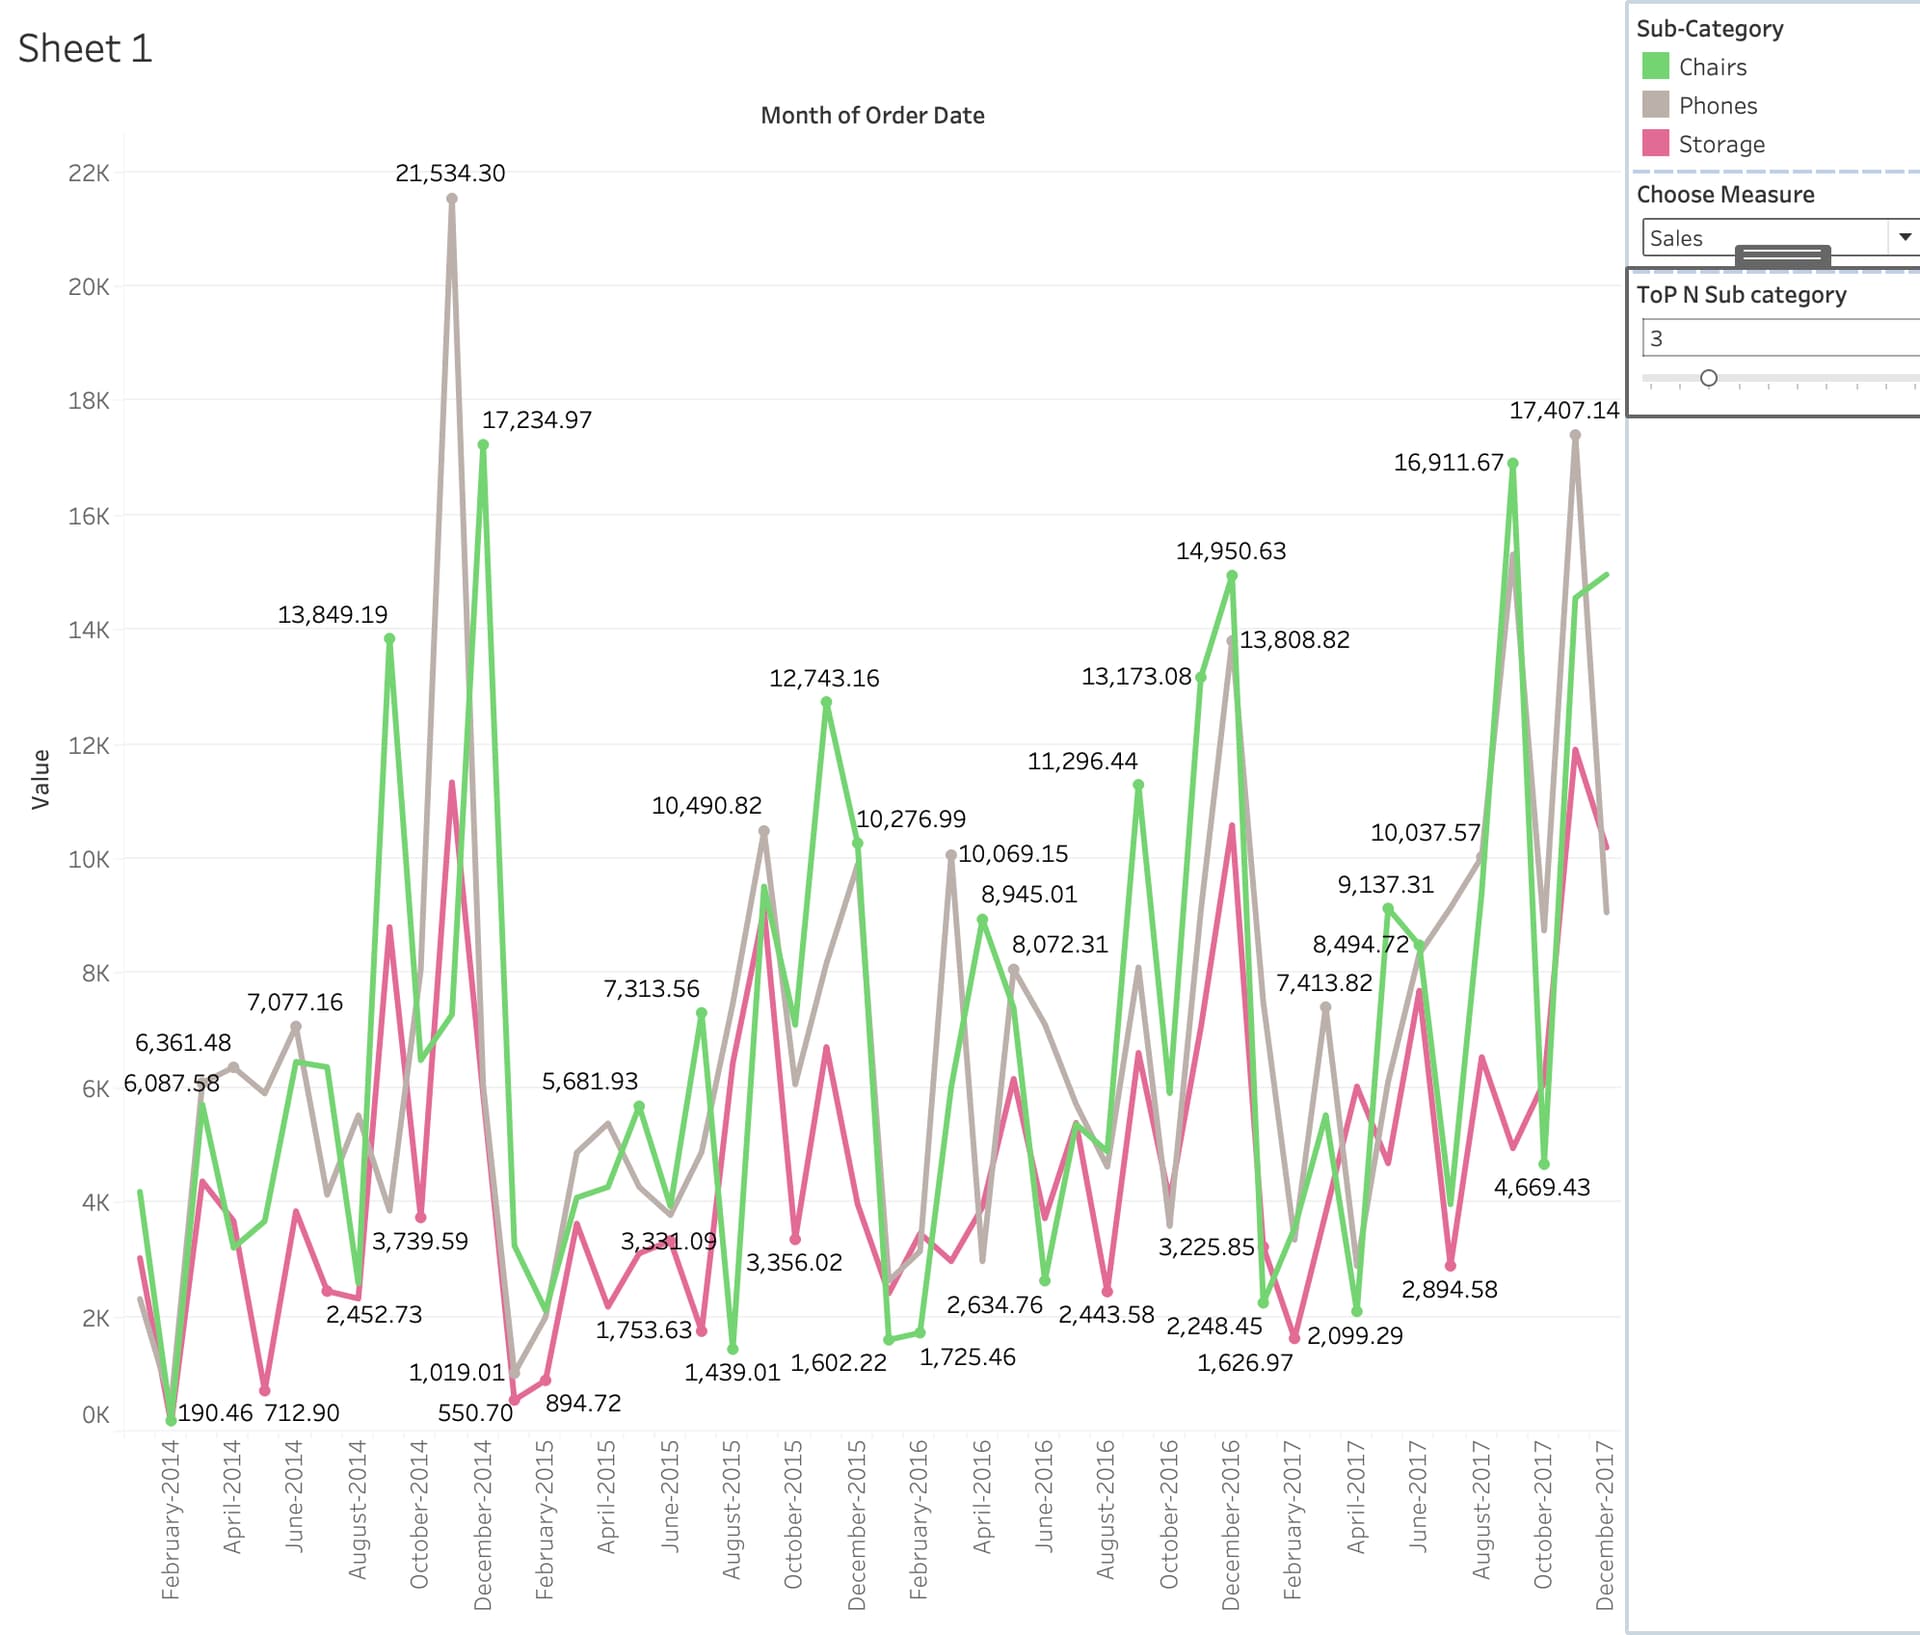
Goal: to add a number widget, when number changes, i.e. top 3, it will show top 3 line trends.
I tried to use limit but it doesn't produces the result that I was expecting.
Hi, you should be able to achive this via a SQL query:
Thanks @dragonsahead , but currently it's a multi-series line plot derived based on timestamps, if i use top n rows directly, it won't select the top category, some of it will only show as dots.
I was just showing that you could interpolate the filter on the top x rows. What I suggest is that you build the full query (could be a cte with several steps) and then try using that top parameter to show the amount you need