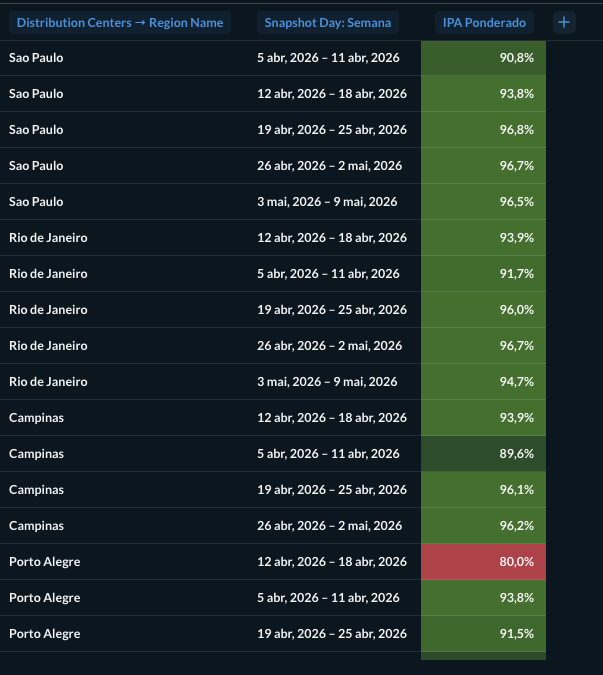
I am struggling to create a Pivot Table where the rows (Distribution Centers) need to be sorted by a metric (Revenue) that should not be visible in the final visualization. Currently, the Metabase Pivot Table requires the sorting field to be present in the "Values/Measures" section to apply the sort logic. If I remove the metric from the summarization step, the sorting is lost. If I keep it, the table becomes cluttered with secondary information that distracts from the primary KPI (IPA Score).
Here is the example:
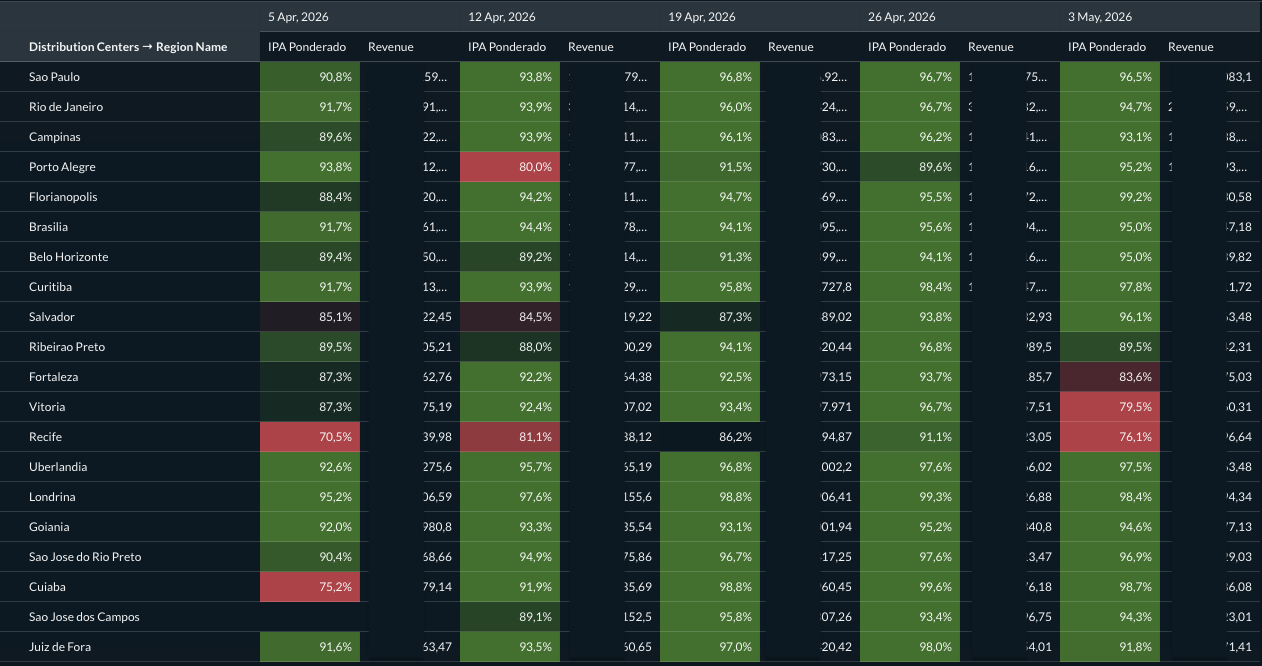
I would like the ability to sort the rows of a Pivot Table by any available metric in the query (or a hidden column) without having to display that metric as a column in the pivot view. Essentially, a "Hide Column" toggle for measures in the Pivot Table settings, similar to what is already available for the standard Table visualization, as you can see in the screenshot below: