On enabling public sharing, and making a dashboard public we see the error An error occurred. The API calls seems to have returned no error
Error screen

Network tab

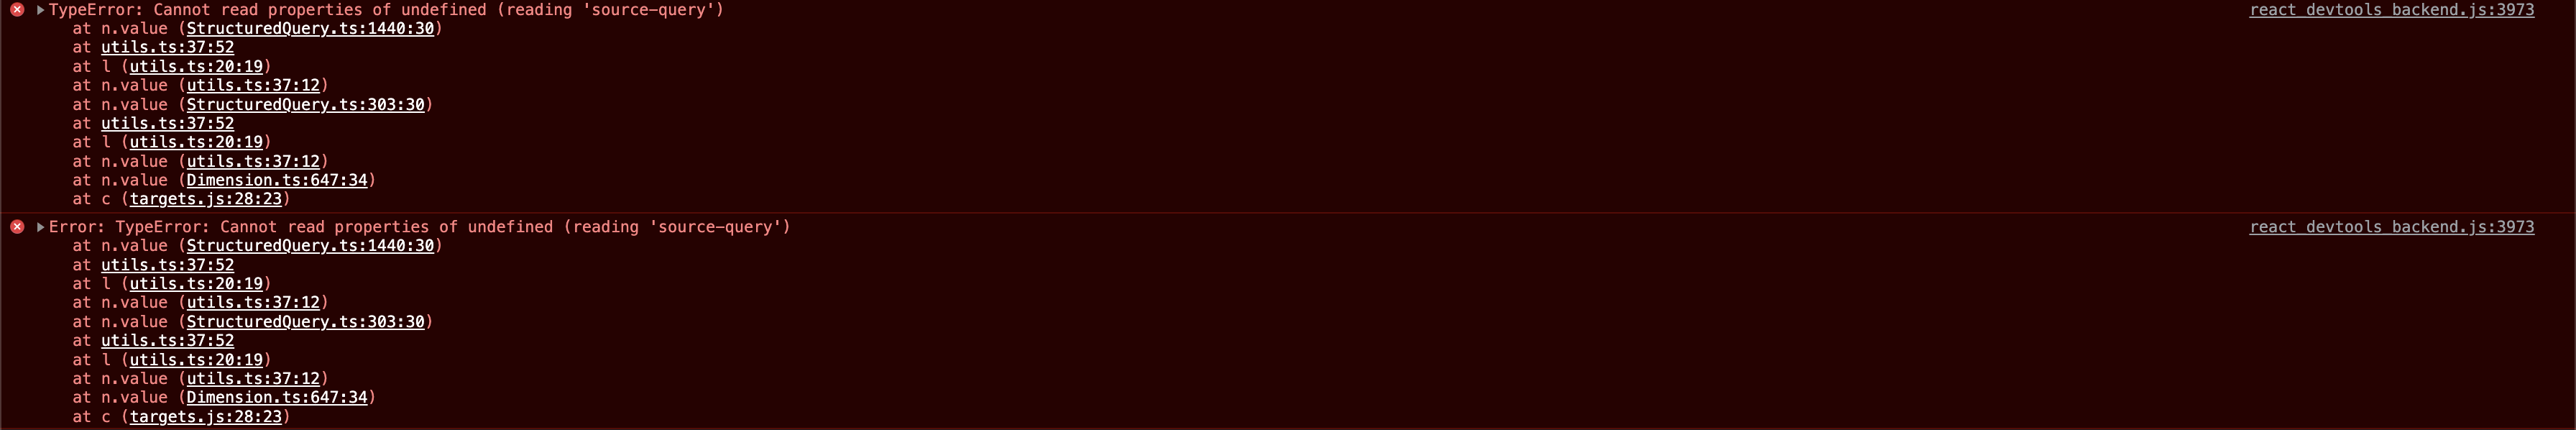
Console error
On enabling public sharing, and making a dashboard public we see the error An error occurred. The API calls seems to have returned no error
Error screen
Network tab
Console error
Hi @arham
Diagnostic Info
{
  "browser-info": {
    "language": "en-GB",
    "platform": "MacIntel",
    "userAgent": "Mozilla/5.0 (Macintosh; Intel Mac OS X 10_15_7) AppleWebKit/537.36 (KHTML, like Gecko) Chrome/101.0.4951.41 Safari/537.36",
    "vendor": "Google Inc."
  },
  "system-info": {
    "file.encoding": "UTF-8",
    "java.runtime.name": "OpenJDK Runtime Environment",
    "java.runtime.version": "11.0.14+9",
    "java.vendor": "Eclipse Adoptium",
    "java.vendor.url": "https://adoptium.net/",
    "java.version": "11.0.14",
    "java.vm.name": "OpenJDK 64-Bit Server VM",
    "java.vm.version": "11.0.14+9",
    "os.name": "Linux",
    "os.version": "5.8.0-1041-aws",
    "user.language": "en",
    "user.timezone": "GMT"
  },
  "metabase-info": {
    "databases": [
      "postgres"
    ],
    "hosting-env": "unknown",
    "application-database": "postgres",
    "application-database-details": {
      "database": {
        "name": "PostgreSQL",
        "version": "13.4"
      },
      "jdbc-driver": {
        "name": "PostgreSQL JDBC Driver",
        "version": "42.2.23"
      }
    },
    "run-mode": "prod",
    "version": {
      "date": "2022-02-08",
      "tag": "v0.42.0",
      "branch": "release-x.42.x",
      "hash": "de1264e"
    },
    "settings": {
      "report-timezone": null
    }
  }
}
There is no error reported in the logs, looks more of a frontend issue
[2f2c0853-80ff-44d3-a643-0b8d571671bb] 2022-05-09T13:10:59+05:30 DEBUG metabase.server.middleware.log GET /api/public/dashboard/feb83d94-d1ce-4aa8-b3ec-65003d74f37f 200 72.3 ms (34 DB calls) App DB connections: 0/15 Jetty threads: 3/50 (5 idle, 0 queued) (110 total active threads) Queries in flight: 0 (0 queued)
[2f2c0853-80ff-44d3-a643-0b8d571671bb] 2022-05-09T13:11:20+05:30 DEBUG metabase.server.middleware.log GET /api/session/properties 200 13.8 ms (4 DB calls) App DB connections: 0/15 Jetty threads: 4/50 (4 idle, 0 queued) (110 total active threads) Queries in flight: 0 (0 queued)
[2f2c0853-80ff-44d3-a643-0b8d571671bb] 2022-05-09T13:11:20+05:30 DEBUG metabase.server.middleware.log GET /api/public/dashboard/feb83d94-d1ce-4aa8-b3ec-65003d74f37f 200 93.0 ms (34 DB calls) App DB connections: 0/15 Jetty threads: 3/50 (5 idle, 0 queued) (110 total active threads) Queries in flight: 0 (0 queued)
[2f2c0853-80ff-44d3-a643-0b8d571671bb] 2022-05-09T13:11:56+05:30 DEBUG metabase.server.middleware.log GET /api/user/current 200 3.5 ms (4 DB calls) App DB connections: 0/15 Jetty threads: 5/50 (2 idle, 0 queued) (105 total active threads) Queries in flight: 0 (0 queued)
[2f2c0853-80ff-44d3-a643-0b8d571671bb] 2022-05-09T13:11:56+05:30 DEBUG metabase.server.middleware.log GET /api/session/properties 200 17.9 ms (4 DB calls) App DB connections: 0/15 Jetty threads: 3/50 (4 idle, 0 queued) (106 total active threads) Queries in flight: 0 (0 queued)
[2f2c0853-80ff-44d3-a643-0b8d571671bb] 2022-05-09T13:11:56+05:30 DEBUG metabase.server.middleware.log GET /api/database 200 4.5 ms (3 DB calls) App DB connections: 1/15 Jetty threads: 5/50 (2 idle, 0 queued) (106 total active threads) Queries in flight: 0 (0 queued)
[2f2c0853-80ff-44d3-a643-0b8d571671bb] 2022-05-09T13:11:56+05:30 DEBUG metabase.server.middleware.log GET /api/collection/root/items 200 5.1 ms (4 DB calls) App DB connections: 1/15 Jetty threads: 4/50 (3 idle, 0 queued) (106 total active threads) Queries in flight: 0 (0 queued)
[2f2c0853-80ff-44d3-a643-0b8d571671bb] 2022-05-09T13:11:56+05:30 DEBUG metabase.server.middleware.log GET /api/collection/root/items 200 6.2 ms (4 DB calls) App DB connections: 0/15 Jetty threads: 3/50 (4 idle, 0 queued) (106 total active threads) Queries in flight: 0 (0 queued)
[2f2c0853-80ff-44d3-a643-0b8d571671bb] 2022-05-09T13:11:57+05:30 DEBUG metabase.server.middleware.log GET /api/automagic-dashboards/database/3/candidates 200 21.8 ms (7 DB calls) App DB connections: 0/15 Jetty threads: 3/50 (4 idle, 0 queued) (106 total active threads) Queries in flight: 0 (0 queued)
[2f2c0853-80ff-44d3-a643-0b8d571671bb] 2022-05-09T13:12:00+05:30 DEBUG metabase.server.middleware.log GET /api/session/properties 200 10.9 ms (4 DB calls) App DB connections: 3/15 Jetty threads: 4/50 (3 idle, 0 queued) (106 total active threads) Queries in flight: 0 (0 queued)
[2f2c0853-80ff-44d3-a643-0b8d571671bb] 2022-05-09T13:12:00+05:30 DEBUG metabase.server.middleware.log GET /api/setting 200 13.1 ms (3 DB calls) App DB connections: 0/15 Jetty threads: 4/50 (3 idle, 0 queued) (106 total active threads) Queries in flight: 0 (0 queued)
[2f2c0853-80ff-44d3-a643-0b8d571671bb] 2022-05-09T13:12:00+05:30 DEBUG metabase.server.middleware.log GET /api/setup/admin_checklist 200 8.8 ms (11 DB calls) App DB connections: 0/15 Jetty threads: 3/50 (4 idle, 0 queued) (107 total active threads) Queries in flight: 0 (0 queued)
[2f2c0853-80ff-44d3-a643-0b8d571671bb] 2022-05-09T13:12:04+05:30 DEBUG metabase.server.middleware.log GET /api/util/bug_report_details 200 1.7 ms (1 DB calls) App DB connections: 0/15 Jetty threads: 3/50 (4 idle, 0 queued) (107 total active threads) Queries in flight: 0 (0 queued)
[2f2c0853-80ff-44d3-a643-0b8d571671bb] 2022-05-09T13:13:32+05:30 DEBUG metabase.server.middleware.log GET /api/public/dashboard/feb83d94-d1ce-4aa8-b3ec-65003d74f37f 200 52.5 ms (34 DB calls) App DB connections: 0/15 Jetty threads: 3/50 (4 idle, 0 queued) (106 total active threads) Queries in flight: 0 (0 queued)
[2f2c0853-80ff-44d3-a643-0b8d571671bb] 2022-05-09T13:13:32+05:30 DEBUG metabase.server.middleware.log GET /api/session/properties 200 16.1 ms (4 DB calls) App DB connections: 0/15 Jetty threads: 3/50 (4 idle, 0 queued) (106 total active threads) Queries in flight: 0 (0 queued)
[2f2c0853-80ff-44d3-a643-0b8d571671bb] 2022-05-09T13:13:35+05:30 DEBUG metabase.server.middleware.log GET /api/user/current 200 3.9 ms (4 DB calls) App DB connections: 0/15 Jetty threads: 4/50 (3 idle, 0 queued) (106 total active threads) Queries in flight: 0 (0 queued)
[2f2c0853-80ff-44d3-a643-0b8d571671bb] 2022-05-09T13:13:35+05:30 DEBUG metabase.server.middleware.log GET /api/session/properties 200 9.0 ms (4 DB calls) App DB connections: 0/15 Jetty threads: 3/50 (4 idle, 0 queued) (106 total active threads) Queries in flight: 0 (0 queued)
[2f2c0853-80ff-44d3-a643-0b8d571671bb] 2022-05-09T13:13:36+05:30 DEBUG metabase.server.middleware.log GET /api/database 200 3.1 ms (3 DB calls) App DB connections: 0/15 Jetty threads: 3/50 (4 idle, 0 queued) (106 total active threads) Queries in flight: 0 (0 queued)
Steps to reproduce the issue
The public dashboard I'm referring to can be accessed at https://analysis.prod.unmarshal.com/public/dashboard/feb83d94-d1ce-4aa8-b3ec-65003d74f37f
@arham You should upgrade immediately to a newer release:
https://github.com/metabase/metabase/releases
It is backward compatible right?
@arham I don't understand what you mean. All data is preserved, when you upgrade, but always make a backup first:
https://www.metabase.com/docs/latest/operations-guide/upgrading-metabase.html